Fault Lines
Dr. Raghuram G. Rajan, the ex-IMF chief economist, ex-RBI Governor and current professor at Chicago Booth School of Business, made a few insightful quotes in his 2010 book “Fault Lines: How Hidden Fractures Still Threaten the World Economy”. These are a good starting point for the argument we want to make that we are all “turning Japanese” over the next decade.
The first two quotes give an insight into what has sustained the huge leveraging up that has happened over the past few decades. As we come to the final legs of this leveraging process, the last two quotes explain some of the political fault lines we are seeing across the world now.
- Cynical as it may seem, easy credit has been used as a palliative throughout history by governments that are unable to address the deeper anxieties of the middle class directly.
- We have long understood that it is not income that matters but consumption. Stripped to its essentials, the argument is that if somehow the consumption of middle class householders keeps up, if they can afford a new car every few years and the occasional exotic holiday, perhaps they will pay less attention to their stagnant monthly pay checks.
- Nationalism, coupled with great faith in the power of the government to enact domestic bargains between labour and capital, has been seen before: it was called fascism then.
- And more than the quality of its institutions, what distinguishes a developed country from a developing one is the degree of consensus in its politics, and thus its ability to take actions to secure a better future despite short-term pain.
Dr. Rajan exposes a system where growing inequality and thin social safety nets create tremendous political pressure to encourage easy credit and keep job creation robust, no matter what the consequences to the economy’s long-term health. This environment of easy credit has been going on for long but the positive impact from this is incrementally reducing. As this happens, the investment environment of the future will not necessarily resemble that of the past. While the Japanese have seen this phenomenon for the past 30 years, the Europeans are seeing it now and the rest of the world, with the U.S. in particular, will see it going forward.
How did we reach the current state?
The essential outcome of democracy (or any political system) is a willingness of a large majority to cede the power to form rules that govern them to a small minority, in return for which they and their children get a continuous improvement in wealth and overall wellbeing. As long as this social contract holds up, both the governed and their leaders are happy. The leaders try their best to keep up their end of the bargain come what may, even if the underlying economic environment does not support this minimum growth expected by the governed.
In the former communist states (e.g. USSR), when this contract could not be sustained, the system broke down. In non-conventional Asian systems like China where this contract has held up, the lack of a conventional democracy has not mattered. In western capitalist systems when the underlying drivers of prosperity started slowing down in the early 1980s, the leaders resorted to “debt”. Debt-funded consumption growth has been used to camouflage the underlying very poor income growth. This was sustainable for as long as dropping interest rates did not increase the pain from leveraging up. This whole process (of dropping rates and increasing leverage) accelerated after the 2008 financial crisis. This is how we have reached where we are today. But with rates near zero, this process is at the end of its runway.
This understanding is the source of why we believe we are all headed the “Japanese way”.
To put more substance to the above discussion we will show a few broad numbers. We have used the U.S. as an example though the numbers are equally, if not more, compelling for the rest of the world.
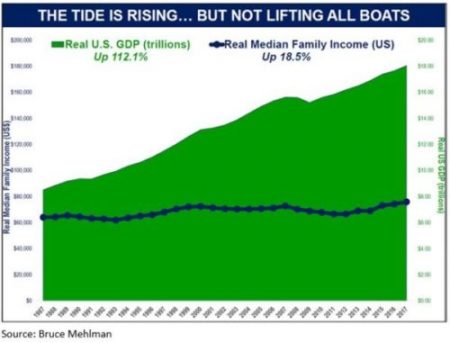
- Family income has hugely lagged GDP growth
While U.S. GDP is up 112% over the past 20 years, the U.S. median house hold income is up only 18%. This gap for consumers is what could have broken the above mentioned social contract between the governed and the leaders. But this contract did not break because of leveraging up.
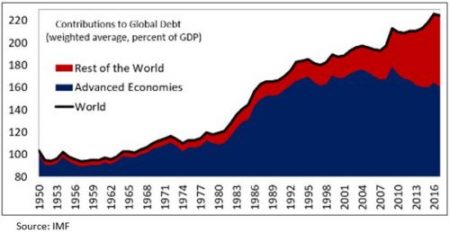
- Global Debt to GDP has been continuously rising
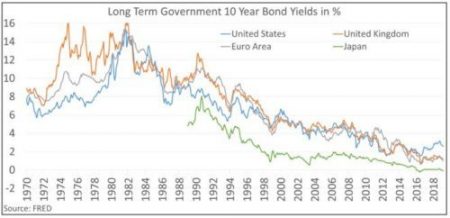
This has been possible because of a steady drop in interest rates for the past 30 years.
What is the Japanese way?
There are certain characteristics of this “Japanese way”:
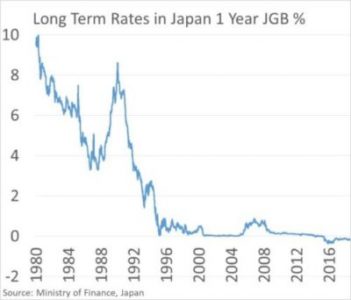
- Extreme financial repression: This manifests in extremely low rates for a long period of term. The biggest losers are the owners of capital. Rates are low across duration as the government becomes the largest buyer of all assets – government bonds, corporate bonds, REITs, equities, etc.
- Increasing Deficit: Deficit is kept high with impunity as long as it is funded by local savings. The deficit was to fund the large white elephant projects earlier and now it is to fund the asset purchases. Also, social expenses need to be funded. In the last 43 years, Japan has had a budget surplus for only 5 years, the last of which was in 1992. Also, the average deficit over this timeframe has been -4.2%.
- Slower Growth: Though deficits boost short term demand, they are just borrowing from future demand. Hence a clear fallout of deficits over a longer period of time is lower growth. Japan’s GDP growth over the past 25 years has averaged only 0.9% p.a.
- Ultra-dovish monetary policy: This manifests in the form of very low rates and a ballooning central bank balance sheet. Japan has been doing both of that for the past 25 years.

Our Contention
We are saying that over the next decade or so, most of the world is heading this Japanese way
Europe was the first to follow, smaller economies like Switzerland, Taiwan, Thailand, Australia and even the U.K. are also headed that way. Today we have over USD 10 trln. worth of government bonds globally which are trading on a negative yield. This represents over 29% of global government bonds. However, given that all U.S. government bonds are trading on positive yield, this is a much bigger proportion for non-U.S. government bonds.
Our more significant contention is that even the U.S. is headed that same way over the next few years
With the U.S. interest rates being the biggest driver of global liquidity and interest rates, the repercussions of this are going to be much bigger and broader. We will elaborate on why we think the U.S. is headed this way later in this write-up.
The Japanese experience of the past 30 years has proved instructive for most central banks. The world’s third largest economy has not had a debt crisis in spite of its central bank having arguably the largest pile of public debt in the world. Japanese government debt to GDP ratio of 236% is huge compared to the U.S.’s 108%. This ratio for Japan was last at 108% over 20 years ago. So not only can you have a large pile of debt, you can seemingly live with it for ever. The only caveat in this is that this debt should be funded by internal savings.
Why is the U.S. headed the Japanese way?
- Firstly, because the Japanese example has proved that economies can get away with a consistently high deficit and an increasing amount of borrowing. For decades the Japanese have been at zero or negative interest rates, have undertaken massive QE, gone in and out of mild recessions, but have always remained on their feet. This looks good enough for most central banks.
- Secondly, the U.S. does not have a choice. The U.S.’s fiscal deficit and government borrowing are expected to balloon over the next decade and more. The only way to plug this fiscal gap is to print more money when the Fed will have to become the lender of last resort to the U.S. government.
To elaborate on this, the logic flows in the following manner:
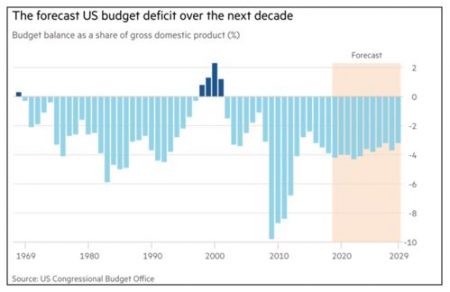
- The U.S. budget deficit has been growing and will keep growing
As a percentage of GDP, the U.S. budget deficit was averaging -2.1% over the period 1968-2008. That average has moved up to -5.1% over the period 2008-20017. The U.S. Congressional Budget Office expects the deficit over the next 10 years to average about 4% of GDP per annum -this is without assuming any recession over that time frame. Also, this does not include the USD 400 bln (about 2% of GDP) of off balance sheet expenditure that is incurred every year. It is therefore not unthinkable to assume that total U.S. government debt to GDP could move up from the current 108% to 170% by 2030.
- Government revenue could be increased but will not be enough
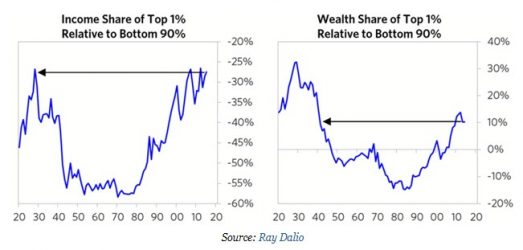
Income inequality has reached historic proportions in the U.S. We can argue about the cause of this – globalisation, technology, cheap capital, lower taxes, weakening of organised labour, etc. – but that does not change the fact that we are presently at one of the worst times in terms of income and wealth distribution.
As seen in the charts below, the income of the top 1% of U.S. households is now 73% of the combined income of the bottom 90%. In the best of times this was only 43%. In terms of absolute wealth, the top 1% in the U.S. is now worth 10% more than the bottom 90%. This is a level not seen since the 1940s.
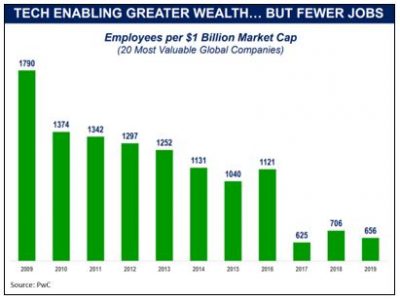
The next chart shows this inequality in a different way. For the top 20 most valuable global companies in 2009 there were 1,790 employees per USD 1 bln. of market cap. This number has slipped to just 656 in 2019. Wealth is seemingly being created with fewer and fewer humans employed. This is an inexorable trend which has a structural pressure that increases
inequality.
Given these facts, it is easy to make a case for an increase in taxation of the wealthy and a redistribution of income and wealth. However, the potential numbers do not seem to be enough and the implementation will be as difficult as in the past (this is one of the reasons why high tax rates have been counterproductive in the past). Taxing at 70% all income over USD 10 mln (as is being proposed by some of the more left wing Democrat voices in the U.S.) would only contribute an additional USD 72 bln of taxes per annum (that is if everyone complies and does not find tax loop holes).Also, let us consider the call to introduce wealth tax. If a 1% wealth tax were imposed on the wealthiest 1%, i.e. those with wealth over USD 10 mln per household, an additional USD 200 bln. per annum of taxes could be generated. Again, this assumes no change in behaviour of the targets of this tax, such as attempts to move assets overseas.This combined number of USD 272 bln. would not make much of a dent in the USD 1.5 trln. to USD 2.0 trln estimate of annual deficit expected over the next decade.
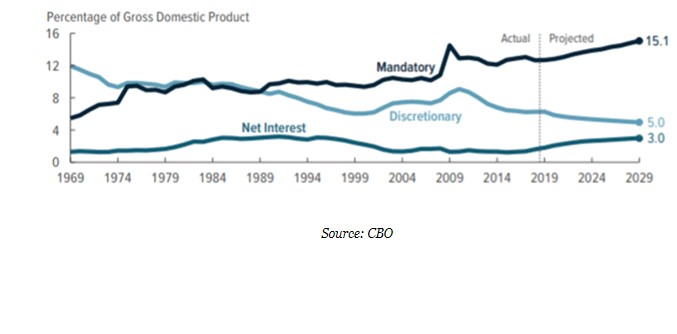
- Government expenditure cannot be cut anymore
This is a holy cow where there seems to bipartisan unanimity. The old Republican conservatives who were a proponent of smaller government seem to have vanished. The primary reason for this is that a large chunk of government expenditure going forward would be for so called non-discretionary items (social security, health care, salaries, pension, interest cost and defence). These items are not easy to roll back without a heavy political cost. Hence, discretionary expense is expected to fall to below 20% of total expenditure by 2029.
Given this high need to borrow and the already high level of debt, interest rates have to be kept low. There is no compulsion at this point, political or economic, to raise rates. Also, the long term reasons to raise rates are being refuted by the Japanese example. Hence our contention that rates will continue to remain low. This story will only end if inflation kicks in, but so far there is no sign of it. Also, as the Japanese example shows, it might not kick in for decades.
Conclusion
- The entire world has hugely ratcheted up debt over the past few decades to maintain the political contract between the governed and their leaders, even while the underlying drivers of this contract have changed.
- We cannot just grow out of this debt pile-up as we are already late in the present growth cycle and have heavily pulled forward future growth.
- The U.S. government’s (and global governments’) borrowing needs will keep going up.
- The Fed will end up monetising this debt and hence will keep interest rates low.
- Hence, like Japan, the U.S. and the rest of the world will become low growth, low interest rate, highly indebted economies.
How to Navigate this New Paradigm
The scenario of low growth and low rates is spreading out of Japan into the rest of the world. When we look back 10 years from now, we could potentially see a majority of the large global economies in this scenario. This will create winners and losers.
Winners will include:
- High yielding assets with underlying fundamentals that are relatively independent of the low GDP growth. Even if these assets have low expected growth, they will get bid up.
- High nominal interest rate economies with potential for growth, low leverage and reasonable regulatory environment. The two top economies that come to mind on this front are India and Indonesia. These are large, low-income, capital-deficit economies with relatively developed financial systems. Also, their relatively low level of leverage and high nominal interest rates will give them an ability to lever up as their interest rates get pulled down by low global rates.
- The remaining few growth assets. Wherever there is demonstrable and sustained growth, the valuation will get irrationally bid up.
The losers will include:
- Companies in the spread business. This primarily includes the pure lending banks and insurance companies.
- Savers with an inability to take risk: There will be no risk free return. To get return one will have to take risk. Hence intermediaries that help savers to navigate this environment will be useful.
- Low return even from risk assets: Aggregate risk asset securities like index funds will struggle to give adequate returns. Hence, there will be a push towards a more active approach to investing.
Our job at River Valley Assets Management will remain to navigate this changing environment to create the best return outcome for our clients. Also, it is imperative that investors recognise this changed environment and not take needless risks in the hunt for unreasonably high returns.
End
Disclaimer
This material is not intended as an offer or solicitation for the purchase or sale of any financial instrument. Information has been obtained from sources believed to be reliable. However, neither its accuracy and completeness, nor the opinions based thereon are guaranteed. Opinions and estimates constitute our judgement as of the date of this material and are subject to change without notice. Past performance is not indicative of future results. This information is directed at accredited investors and institutional investors only.