The developed markets’ rally of the past two years has been largely driven by a valuation increase based on expectation of strong earnings growth. The S&P 500 is up 44% in the last two years. However, over the same time frame real EPS growth has been negligible with the trailing PE moving from 13x to 19x. Clearly the market is expecting a strong earnings growth.
One of the indicators we have regularly looked at in the past was the Shiller PE (or the cyclically adjusted PE – “CAPE”). Without going into too much technical detail, it would suffice to explain this ratio as basically the PE with EPS smoothened out over the previous ten years and adjusted for inflation. Wikipedia describes this ratio as “price divided by the average of ten years of earnings, adjusted for inflation”. This ratio gives a good idea of where we are in terms of long term valuation. We are currently at the very high end of the last 130-year range (not counting the “irrational exuberance” of the 1995-2000 era and the 1929 earnings crash).
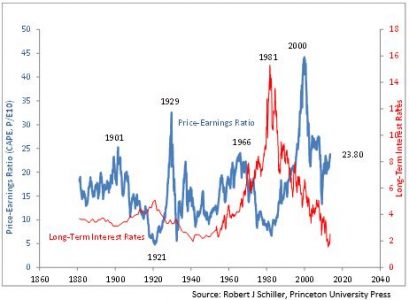
The chart below plots the CAPE.
Some points to note here are:
- The CAPE broadly has a negative correlation with long term interest rates (which are now bottoming).
- Secondly, we are currently at the very high end of the last 130-year range (not counting the “irrational exuberance” of the 1995-2000 era and the 1929 earnings crash). The current CAPE for S&P 500 is 24x with long term average at 16.5.
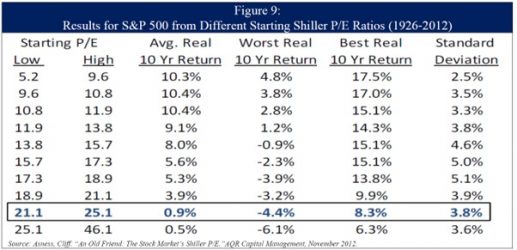
- Finally, as shown in the table below, from the current high levels of valuation, the forward long term stock returns have been poor. Historically when starting CAPE is between 21 and 25, the 10-year average annual forward stock return is only 0.9% p.a.
Hence our stance on markets as a whole is cautious. But this is more a longer term view and more relevant to developed markets in general and the US in particular.
If we were to look at emerging markets, the story seems to be the opposite with markets priced very cheap but with higher short term earnings uncertainty. The current CAPE for EM is 13.5 with the long term average at 16.9.
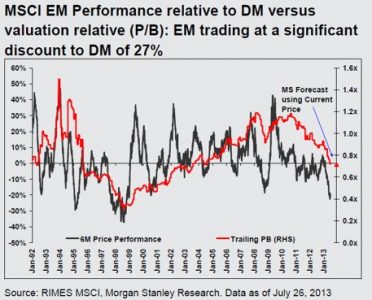
This valuation gap is manifest also through the drop in relative P/B of EM to DM (see chart below). We are back at the levels of 2003 when the memory of the Asian and Russian crises were still fresh. Thus the EM valuations are pricing in at least a mini crisis.
This conclusion is also backed by the bottom up anecdotes of how cheap some of the good EM businesses are. Our ability to make money from these will depend on our ability to navigate through the near term earnings uncertainty in these markets.
End
Disclaimer
This material is not intended as an offer or solicitation for the purchase or sale of any financial instrument. Information has been obtained from sources believed to be reliable. However, neither its accuracy and completeness, nor the opinions based thereon are guaranteed. Opinions and estimates constitute our judgement as of the date of this material and are subject to change without notice. Past performance is not indicative of future results. This information is directed at accredited investors and institutional investors only.