We often get asked to compare the quantum, source and quality of the return from the US market and the return from Asian markets (our home market) from the perspective of where more wealth has been created, how investors can participate in this wealth creation and the sustainability of this wealth creation. This is our short analysis addressing these issues.
Returns From The Two Markets
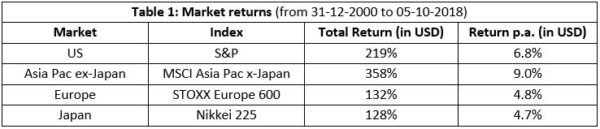
The two growth pockets of the world – the US and Asia Pacific ex-Japan – have given strong equity returns over the past 18 years (since the end of 2000). The US market (S&P) is up 219%, compounding at 6.8% p.a. On the other hand, Asia Pacific ex-Japan (MSCI Asia Pac ex-Japan) is up 358%, compounding at 9.0% p.a. This compares favourably with the 4.8% p.a. return for Europe and 4.7% p.a. for Japan.
However, this overall return profile hides two distinct halves. In the first 9 years of this period, the Asian index was up 182% whereas the US market was up only 1.7%. But in the second 9-year period, the US market’s total return was up 213% while the Asian market was up only 62%. In other words, over half of the underperformance of S&P in the first phase was made up by its outperformance in the second phase. One point to remember is that in spite of this underperformance over the past 9 years, Asia still outperforms the S&P by over 2.2% p.a. over the 18-year period – this is the difference between a total return of 219% and 358% over this timeframe.
Why have Asian returns lagged US market returns in the past nine years?
The question is, ‘why have relative returns been so different over these two time periods even though the returns over the full 18 years are comparable?’
To understand this better let us recap what we have said in the past about returns.
Total Return from Equity Stock = Change in EPS x Change in PE + Annual Dividend
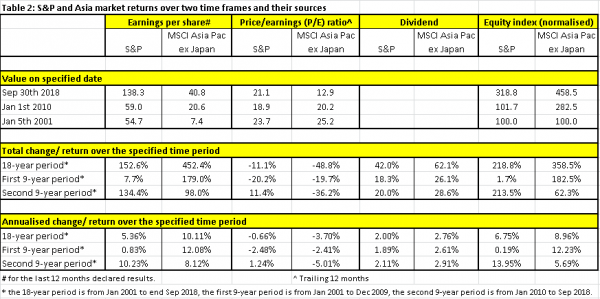
Let us look at each of these components separately (Table 2 has all the data being referred to in this discussion).
Annual Dividend
This is the least volatile source of returns. For Asia, the long term return from this factor (over the 18 years) is 2.8% p.a. and for the US it is 2% p.a. Not very different. Also, the 18-year number does not differ dramatically over the two 9-year periods. Hence dividend does not do much to explain the difference in total performance of the two markets.
Change in EPS
Here the numbers start diverging – both across these two markets and across the two time periods. Over the 18 years, Asia’s earnings (in USD) have compounded at 10.1% p.a. whereas US’s earnings have compounded at 5.4% p.a. This is a remarkable difference but not surprising given the faster overall GDP growth in the Asian markets.
The bigger difference is in how this EPS growth profile has changed over the two time frames. Asian EPS grew at 12.1% p.a. in period 1 and slowed down to 8.1% in the second period. This is a clear slowdown but is within acceptable ranges given other factors. The more stark change is in the US. Here the first period had an EPS growth of only 0.8% p.a. but accelerated to an astounding 10.2% p.a. in the second period. This is a very wide range and is counterintuitive to what “steadier” markets like the US should show. Why this has happened is a long discussion for some other day, but the point is that this has happened for the US markets.
Change in PE
This is the most volatile component of total returns in the short term. But in the very long term it has had upper and lower bounds which have rarely been sustainably broken. The S&P over the past 65 years has traded below a PE of 10 for only 9.5% of the time (mostly during the very high interest rate environment of 1975-82 when US 10yr rates reached over 14%). Also, it has traded over a PE of 25x for only about 7.5% of the time (mostly during the dotcom bubble of 1998-2001). For 83% of the time the market has traded within this band of 10-25x trailing earnings. We believe that this band will sustain and remain consistent for our investable future too.
The Asian and the US markets started at similar valuations at the beginning of the 18-year period (Asia at 25x and the US at 24x). Both de-rated broadly equally over the first period by about 20% each – Asian PE dropping to 20x and the US PE to 19x. The divergence has happened after that. Asia continued to de-rate reaching a PE of 13x now but the US re-rated back to 21x. Thus over the 18-year period Asian PE de-rated by about 48%, whereas the US PE went down by only 11%. This is a large source of the outperformance of the US market compared to Asia over the past 9 years.
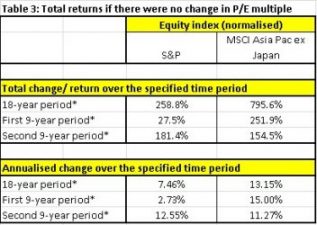
If the PE had not changed for both these markets over the past 18 years, the relative return profile would have been very different (as seen in Table 3 alongside).
The Asian markets would have given an annual total return of a whopping 13.1% p.a. and the US market would have given 7.5% p.a. (respectable but nowhere near the Asian numbers).
Importantly, in the second 9-year period, Asian markets would have given a return of 11.3% p.a., quite comparable to the US market return of 12.6% p.a. over the same timeframe.
Conclusion
Current Asian valuations are at the lowest end of the long term range of PEs. Hence, looking forward, we do not carry a risk of a permanent negative load on returns from PE de-rating. Therefore this analysis helps us focus on the long term source of returns for equity investors – the earnings growth in the company and the cash return by the company. Asian companies have done a stellar job on this front, out pacing the US by 4.7% p.a. over the 18-year period. Our expectation is that this relative outperformance will be maintained because of various structural reasons, primarily the fact that Asia is a net saver economy on a relative low level of per capita GDP and hence still has the catch-up trade to play.
The valuation risk for Asia is mitigated by the fact that it is at the lower end of the long term range of PEs (PE of 13x vis-à-vis the range of 10-25x) as compared to the US market which is at the upper end at 20x.
Hence, from the current point going forward there is a high probability that returns from Asian markets over the longer term should be above their long term average and should show a positive relative return vis-à-vis the US markets.
End
Disclaimer
This material is not intended as an offer or solicitation for the purchase or sale of any financial instrument. Information has been obtained from sources believed to be reliable. However, neither its accuracy and completeness, nor the opinions based thereon are guaranteed. Opinions and estimates constitute our judgement as of the date of this material and are subject to change without notice. Past performance is not indicative of future results. This information is directed at accredited investors and institutional investors only.