As markets continue with their usual news-driven volatility swinging around with every data or tweet, we continue to look through the near term and try to identify trends and themes which will outlive the immediate gratification of today’s events. In our write-up for last month An Idea in India we did some crystal ball gazing to anchor the economic and growth landscape in Asia over the next few years and then went onto enunciate an idea which investors could position into given recent events. This month we scour well established themes in the western world to identify trends which could take hold in Asia over the next few years.
As economies grow and prosperity increases, the growth of the wealth management industry is a very obvious trend not just in Asia but globally. What is different in Asia is the nascence and the first-generation nature of wealth accumulation, unlike the western world where wealth accumulation has taken place over generations thereby leading to well established, tried and tested practices. Asian wealth accumulation is taking place not only at the super wealthy high net worth segment but also among the educated and growing middle class segment of the population. The needs, wants and aspirations of this segment across the world are similar, especially in today’s globalized world where connectedness means that everybody seeks the best for themselves. Many of our clients fit into this segment. When we listen to our clients and look at trends in the world, we see similarities and, at the same time, a glaring gap in Asia – lack of diversification outside home markets.
Global Landscape
The global wealth management business is witnessing significant shifts. While wealth generation is slowing in developed countries, it is growing in emerging markets, in particular in Asia-Pacific. Despite slowing global economic growth, wealth managers’ AUMs have exhibited a healthy growth rate of 4% p.a. (industry sources). The reason for this is positive flows from Net New Money (NNM) which offsets impact of market movements. It is expected that NNM will continue to be the key driver, especially as wealth accumulation grows in the Asia-Pacific region. We are naturally curious to understand where this money gets invested and what new trends are likely to emerge in the future.
The U.S. not only has the largest pool of accumulated wealth but is a deep and sophisticated market on which many financial theories and trends are based. Hence, we first looked at how the investing landscape has evolved there over time.
The single largest pool of assets in the world is the US pension accounts (IRA) with over $ 4tr of assets. Till the 80’s most of this money was invested domestically and there was hardly any interest in exposure outside the home market. That perhaps changed after the downturn experienced in 1987.
The trend of investing in offshore assets in the US became more apparent over the last two decades as globalization made it easier at the same time as regulations started converging globally. U.S. Individuals began to warm up to global investments about 30 years ago even though the U.S. equity market has been the best performing equity market over most time horizons. What was US$6bn in 1990 grew at a rate of 36.6% p.a. in the first decade to US$136bn by 2000.
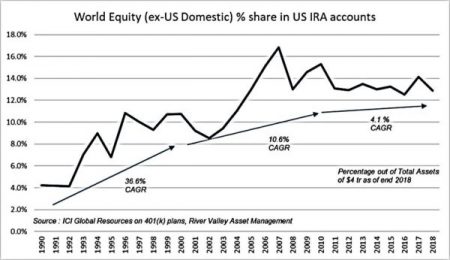
Subsequently while the growth rate gradually slowed, we currently have more than $500bn of US Individual assets invested outside of their home market, an almost three-fold increase over subsequent decades. The chart above shows this trend. Since 2010, while growth of offshore investments has been in line with wealth accumulation in the U.S., the share of offshore assets in the total has been stable at 12-15%.
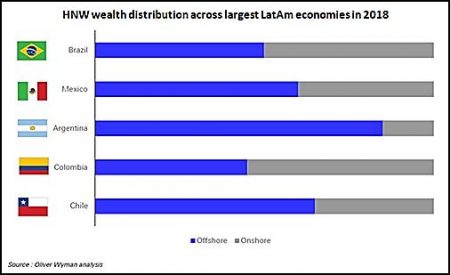
Looking at emerging markets, Latin America stands out as a region where investors have a significant portion of their assets outside their home markets – this is not surprising given the instability in their country regimes. While data in these markets are not as reliable, when one looks at recent trends of where High Net Worth (HNW) individuals in these economics are investing, one can gather that more than half of new flows are going towards offshore assets. The chart alongside shows this trend clearly.
The Case for Diversification
Investing outside of home markets as a theme has its novelty, but any investors putting their hard-earned money to work need to understand the benefits for stepping away from their natural home market familiarity. Especially in Asia, where growth is stronger, we constantly get the question, “Are we not better off investing locally?”
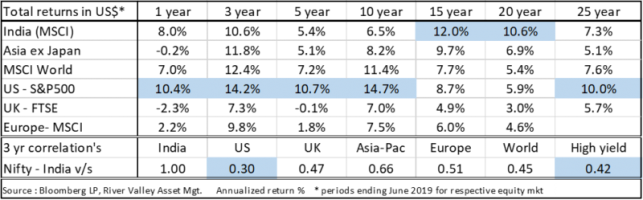
The table above compares returns achieved by various markets/ regions of the world over short and long-time horizons. The key conclusions for us are the following:
- Different regions show better returns over different time horizons;
- Despite strong economic growth, Asian markets have not always been the best performing equity markets. For example, over 25 years a low growth developed market like the U.K. has delivered better equity returns than Asia-ex-Japan mainly because companies listed in the U.K. have used economic growth in different parts of the world and translated them into earnings growth for shareholders, better than in many fast-growing Asian markets. The last line in the table shows the correlation of the Indian market to various other markets. As one can observe, despite similar ballpark returns, the correlation of India versus markets like the U.S. and MSCI World is very low. Modern portfolio theory helps us understand that one can significantly reduce a portfolio’s risk by combining two assets with low correlations.
- In simple terms, not putting all one’s eggs in one basket can help improve an investor’s risk-adjusted returns and that is where diversification outside of home market helps in preserving and growing one’s wealth.
The Asian Landscape
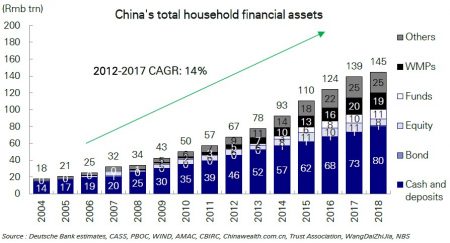
Closer home, in Asia, we observe that the path to overseas diversification of investible wealth may not be too different from what we gleaned from analysing U.S. trends. Over the last two decades, strong economic growth and rising prosperity has created wealth in China which is now showing up in the growth of financial assets (chart alongside). Over the last five years this pool has grown at 14% p.a.
As wealth grew and regulations became relaxed, we started to see Chinese investors slowly looking to diversify their assets by investing offshore, a trend which started about a decade back. Over the last five years, this pool of assets has grown at a CAGR of 38% (chart below), a rate very similar to growth rates seen in the U.S. IRA accounts when the first wave of offshore diversification started there three decades back.
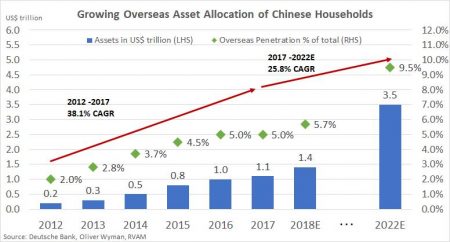
When we analyse the trends across markets, the urge to go offshore starts when per capita GDP crosses $3,500, a level generally ascribed to an emerging middle-income economy. Chinese offshore financial assets which were 2% of GDP in 2012 at US$0.2trn have now grown to US$1.4trn in 2018 and accounts for ~10% of China’s GDP.
With increasing restrictions on shadow banking and reduction in guaranteed high-return products, it is only logical to expect HNW investors in China to increasingly look offshore, seeking higher returns. Penetration, which is currently at 5%, is likely to reach 9-10% over the next 5 years and most likely stabilize at levels seen in the U.S. (more on that later).
The other closed economy in Asia which has opened up recently is India. We believe that as prosperity increases and per capital income grows, we are likely to see a similar trend there as in China. Both countries have historically had similar and cautious regulatory environments in terms of capital controls with gradual liberalization. As far as India is concerned, it could follow the path charted by China with a lag of a decade.
LRS Route – Path to Diversification of Indian Wealth
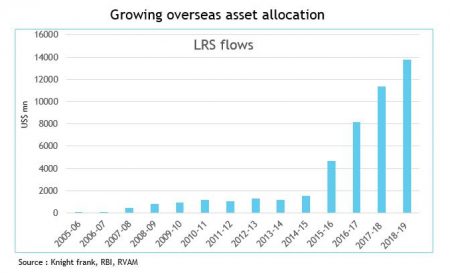
Unlike China, the path to offshore diversification is more cumbersome in India and comes under the Liberalised Remittance Scheme (LRS) made available by the Reserve Bank of India (RBI). Resident Indian individuals are allowed to remit only a limited amount, which has recently been increased to USD$250,000 per financial year. Over the last three years, overseas investments/allocations by Indians have grown by 44% p.a., although from a very low base (chart alongside). Cumulatively, we estimate the total stock of LRS capital at US$46bn which works out to 1.7% of GDP, very similar to the 2% level at which the offshore investing trend started taking off in China.
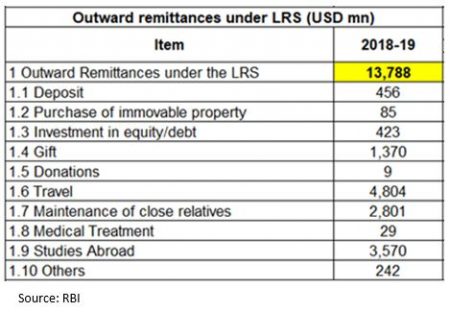
The peculiarity of offshore flows from India is in where they are getting deployed. The following table from the RBI shows the mix of LRS outflow for the last financial year.
Of the total outward remittances of US$13.8bn in FY19, a mere 3% went into direct investments into equities/bonds. A significant portion was used up for travel (35%) and education (25%). Again, we see similarities with trends in China. The first wave of offshore experience for the affluent mainland Chinese was to travel and experience sights overseas. Today it has reached a proportion where the largest tourist source market globally is China. Some of the best performing stocks in Asia over the last decade have been plays on the Chinese travel theme. We believe that the next leg of offshore capital deployment from India will be in offshore investments as the sophisticated investor in India starts understanding the benefits of diversification and gets comfortable with the fact that one does not sacrifice returns by investing offshore but, with diversification, the risk-return trade off of the portfolio improves dramatically.
Sizing the Potential in India
We used the penetration statstics gathered from the U.S. and China to estimate the potential in India. Assuming that India’s GDP were to grow at a conservative 5.5-6.5% CAGR up to 2025, it could reach a size of between US$3.9-4.2trn. If at this level, we reach 3-4% of HNW assets getting deployed offshore, then that would amount to assets of US$120-170bn. This represents a modest growth of 40% CAGR from today’s base, very similar to growth rates observed in China and the U.S. during the initial phases of offshore diversification. Starting from a nil base, the numbers are indeed huge for any wealth manager in India to take this opportunity seriously. The winner will be who has a clear international strategy to grab the first mover advantage. And we have an example of such a winner from China.
Noah Holdings: The Chinese Example
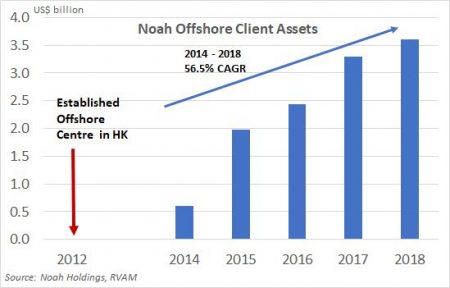
One example of a wealth manager seizing the opportunity in China is Noah Holdings Ltd., a NASDAQ listed company (Ticker NOAH US) with operations in China. It currently has assets under management (AUM) of US$24.6bn (end of 2018), of which the offshore AUM stood at US$3.6bn, i.e. 14.5% of assets.
Noah established an offshore centre in Hong Kong in 2012, just when the Chinese offshore space was ready to take off and, after a phase of rapid growth over a period of 6 years, the management is seeing the growth rates stabilizing in the offshore space. What struck us about the number is that client assets offshore as a % of total AUM is stabilizing at a level which is very similar to where offshore assets stabilized in the U.S. (12-14% of total). This is one of the most profitable divisions for Noah and, unlike the domestic onshore business, there is less competition in this space and assets could be stickier. Noah’s success demonstrates the power and advantage of being an early mover.
Who could be India’s Noah? This is one we are now actively seeking!
End
Disclaimer
This material is not intended as an offer or solicitation for the purchase or sale of any financial instrument. Information has been obtained from sources believed to be reliable. However, neither its accuracy and completeness, nor the opinions based thereon are guaranteed. Opinions and estimates constitute our judgement as of the date of this material and are subject to change without notice. Past performance is not indicative of future results. This information is directed at accredited investors and institutional investors only.