March 2020 changed life for everybody on planet Earth. As we watched China battling and getting the flu-like epidemic “coronavirus” under control, the world as we knew it exploded around us, with the pandemic spread causing country after country to enforce economic shutdowns, restraining people indoors to ensure social distancing to prevent the spread of this yet-to-be-fully-understood pandemic. A month on, we are still largely in unknown and unprecedented territory.
Human beings and policy makers are faced with having to make unenviable choices – stuck between the “fear for life” and “the fear for livelihood”. This unprecedented health crisis has brought us to uncharted territory, as shutdowns have unforeseeable economic impacts and, given the leverage and fragilities in the global economic systems, unpredictable impact on financial markets. Ultimately, there are likely to be new winners and losers, but given the unknown long-term economic impact, the ability to position a portfolio for this at this point is at best tenuous.
While we ponder the unknowns, many positives are building up, starting with the sharp drop in interest rates as most major economies head towards zero rates, thus dramatically reducing the cost of capital. Secondly, we are seeing various countries proposing large fiscal rescue packages and liquidity infusions into their economies. The difference between the negatives and the positives is that the former are fully front-loaded while the latter will be back-loaded.
Our base case at River Valley Asset Management is that life will go on as all of us adjust to a new normal. People will eat, work and meet differently, medicate, entertain, bank, borrow and, yes, also travel. While the immediate cost is high with tragic losses of lives, humanity has time and again shown its ability to bounce back faster and prove doomsayers wrong. In the corporate world some companies might not survive this turmoil, some individuals may financially take long to recover, but the survivors will come out stronger and, over time, wealthier.
Our job as investors is to ensure that our clients come out of this stronger. First, as investors, we should ensure that we have the holding power – both emotionally and financially – to go through this upheaval. Second, we must ensure that the businesses we own are also resilient enough to go through this tumultuous period and come out stronger.
Given this construct, we should not lose sight of a key fact – across the world we are getting assets at much cheaper prices than even a few months ago. This includes great long-term businesses which are at multi-decade lows in terms of their market value. Some of them will be classic value traps, but many will survive and come out stronger. The challenge is to identify and invest in the second category of businesses. Portfolio management is all about positioning investments to maximize future potential without getting anchored in either the current or the past. The path to the future may continue to be volatile but getting confidence on the anchor and being disciplined about the goals is the key to wealth preservation and return maximization.
The Health Crisis
The COVID-19 situation is unprecedented in terms of both the medical impact and the economic impact. The virus, which started somewhere in or around Wuhan in China in around December, has now spread to over 210 countries. As of Easter Sunday, about 1.8mn people have been confirmed to have the infection while more than 110,000 people have died. This makes the mortality rate look very high, but the infected numbers are certainly understated by a large margin as countries struggle to ramp-up testing capability. As this pans out across various geographies, a lot more data is now available compared to even a few weeks ago. This makes some forward-looking projections possible.
The Chinese example – especially of Hubei province – tells us a few things:
- Till a cure is found, the only solution is aggressive social distancing to ensure that the local medical capacities do not get overwhelmed.
- In case a total lockdown becomes necessary, it takes 40 to 60 days to get the numbers under control (i.e. to plateau).
- The disease infects every age group but is more infectious/fatal for the elderly.
- Countries that take action early see less damage (like South Korea/ Taiwan) compared to late movers (Italy/ Spain/ New York), but once social distancing is seriously implemented, the results consistently improve in all countries. Tapering off of infections and fatalities in countries like China, South Korea and now tentatively in Italy, Spain and New York mean that there is light at the end of the tunnel.
- The next countries to see a peaking out are potentially the U.S. and the U.K. (before the end of April 2020). The big question mark remains on developing countries like India, Indonesia and Brazil. It is easy to paint a very dire outcome for these markets, but multiple factors such as early lockdowns, onset of summer, prior anti-microbial resistance could improve the calculation. If these markets escape without a huge hit, then we might be able to see the worst of this pandemic behind us in the next two months.
How Will It Pan Out?
In the short term, how things pan out is totally dependent on social distancing over the next two months in most countries. The question is: what after that? The base case solution likely to emerge will be a combination of (1) aggressive testing leading to better identification and isolation of the infected rather than closing down whole economies, (2) Positive results from the multiple anti-viral treatments that are being tested, (3) a larger portion of society developing herd immunity over the next 12-18 months either by getting mild exposure or through successful development of a vaccine.
Green Shoots
As society gets its act together, we are seeing a large amount of effort and money being dedicated to solving the medical challenge facing us.
- On the testing front: once governments got their act together, both speed and numbers have picked up dramatically. From early days when test results took a few days, we now have high volume tests which can give results in less than 15 minutes. Ramp up of these efforts are crucial in determining the timeline for economic restart.
- The work on cures has also ramped up dramatically. Clinical studies are being conducted on 3 to 4 different treatment solutions. One drug with high expectations is Remdesivir by Gilead, where the first test results are expected to come by the end of April. This drug was developed and trialled for Ebola (where its efficacy was only mediocre) but most importantly it had already been cleared as having no critical side effects. It is currently being prescribed on a compassionate basis for last stage COVID-19 patients. The real game changer will be when we see scientifically positive efficacy test results.
- Vaccines are the final solution. In theory, we are all likely to develop immunity either by being infected ourselves or through a vaccine. But vaccines take long to develop – usually 12-18 months, though there is talk of a viable vaccine being available by end of 2020.
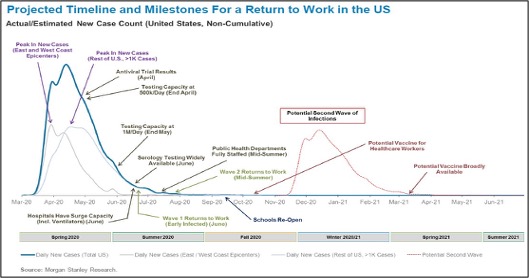
The chart above from Morgan Stanley Research on U.S. recovery encapsulates our own view on the potential timelines of a recovery in activity as COVID-19 comes under human control.
Worst Case Scenario
The worst case will be a large second wave when we reopen post a couple of months of social distancing and patient numbers start going up again. This would be a disastrous scenario if it were to happen in big numbers before cures become available. Here, China is the primary test case. They have started tentatively opening again and we will know the impact over the next 4-6 weeks. Countries like the Czech Republic, Denmark and Norway are also slowly opening over the next few days and weeks.
The Economic Impact: How Bad Can It Get?
Human economic activity is not supposed to come to an absolute stop all together everywhere in the world, but that is exactly what we are staring at. The short-term economic impact is significant – and that could be a huge understatement. Just imagine the economic impact on a community that has a large natural disaster like a tsunami or an earthquake. Every economic activity will suddenly stop, other communities will have to chip in to help this devastated region. Now imagine this not in one finite community but across most of the world. This is broadly what we are facing. But the good thing is that unlike a natural disaster, the damage to assets and means of production here is minimal; this means that the economic engines can be turned on instantaneously, once we have confidence that we have controlled the virus.
Most economists are assuming a negative global GDP growth rate of 2-3% in Q1 2020, moving to negative 5-10% in Q2 and recovering to a positive 2-3% by Q4. This implies a negative 3-5% GDP growth in 2020, a far cry from the 3.3% real growth for 2020 expected by the IMF as recently as January 2020. Going into 2021, global GDP should grow by 4-6%. But these numbers have a large dispersion, and estimates are changing rapidly with news flow on the virus, shutdowns and the subsequent policy responses of various governments. The rapidly deteriorating economic situation has resulted in an unprecedented squeeze on liquidity and financial resources globally, and has caused a global “dollar liquidity” crunch.
Policy Response And Its Impact
To give credit where it is due, policy responses by most economies have been swift and forceful beyond precedent. Central banks, having learned their lessons from 2008, jumped in aggressively to try to ensure that the liquidity freeze does not last long. During extreme periods of uncertainty (like now and in 2008), the market’s price discovery mechanism freezes up. There is a virtual buyers’ strike with no buyers for any asset. People just want to hold USD cash. It is then that the central bank (led by the Fed in this case) becomes the buyer of last resort. The Fed started by buying the safest assets like U.S. treasuries, then moved into buying high grade corporate credit and has now announced that it would also be looking at buying some high yield credit. This gives the market time to find a price and settle down. Also, unlike in the past, the Fed has not given a finite budget for how much it will buy – it has just said “whatever it takes”.
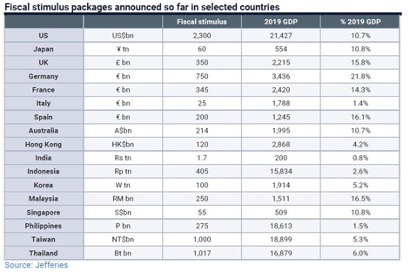
The monetary responses have been supported by exceptional fiscal responses where governments across the world have come out with massive policy packages, many upwards of 10-20% of GDP (as shown in the table above). The old mantra of a balanced budgets, low deficit, etc. has been totally given up on. If only one country had done this, they would have been punished by a run on their currency. But since all the economies are doing it simultaneously, the currency world has been relatively stable.
Combined, the two – monetary and fiscal response – are very large bazookas. At the minimum these will help to cushion the blow of the short-term economic freeze. If economic forecasters are right on the GDP impact in 2020 of negative 3-5%, the fiscal support which is multiples of that will result in a quick and rapid recovery in economies going into 2021.
Green Shoots
China is where it all started and China is where we need to look for the green shoots. And on that count, we are starting to see economic activity picking up. March economic activity was much better than the February numbers and first week of April continues the trend.
- Shanghai metro traffic in the first week of April is down 47% yoy compared to down 86% in the end of February
- 30 major city new home sales volume is down 22.2% yoy in early April compared to being down 76% towards the end of February
- Coal consumption is down 16% in early April compared to down 41% in end February
- 90% of migrant workers are back in their workplaces as of early April.
We saw a very similar trend during SARS in 2003 with May activity numbers looking appalling but gradually normalizing by July 2003. The fear is that this will have a second leg down and hence these numbers must be closely monitored. If Chinese activity keeps improving, this will be a template of how things could turn out in the rest of the world.
How Will It Pan Out?
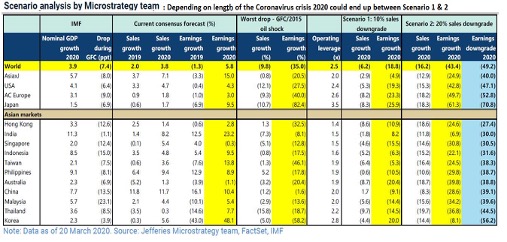
Our base case in terms of global GDP growth is that the worst impact is being felt in the Q1-Q3 period with Q2 being the worst. We will potentially start seeing positive growth from Q4 with an above average global growth number for 2021. This obviously depends on the virus-related numbers peaking in the next two months. This means 2020 corporate earnings will see a decline of 20-30% globally. But in 2021 we could see rapid normalisation. The scenario analysis below shows the range of outcomes depending on how steep the decline is in 2020.
Overlaid on this scenario will be the impact of low rates, huge fiscal packages and an enlarged government debt book. The impact of these (positives and negatives) are likely to be felt over the longer run and will linger on with us for a lot longer than the virus itself.
Worst Case Scenario
This would happen if the virus situation prolongs at or near the current level of intensity for longer than the two-month period currently envisaged. The economic impact in that case would be worse than our base case. This is something which is unfathomable and a likely source of market volatility.
Changes That Will Become Permanent
Many things will not change – humanity will survive, humans will retain their intrinsic desire to do better for themselves and interact with each other, economic progress will always be desired, and so on. But some things will change for the long term:
- Many weak companies, financially weak individuals and economies will be permanently damaged. They will not have the luxury of returning to a new normal.
- Interest rates will remain low for the foreseeable future. This is the only way to repair and sustain the high debt loads the world is going to inherit after this crisis.
- The damage to the psyche of investors will be long lasting and the trauma of the past few weeks will be an important part of how we buy and price assets for quite some time.
- Some sectors and companies will surely come out stronger post this crisis. Many sectors will see accelerated consolidation as the weaker competitors die. Also, the easy access to capital that a large number of new economy companies had will reverse. The players with genuinely good products will do better but players which became disruptors only based on easy access to capital will get shaken out.
Financial Markets – Understanding Them And Positioning For The Future
The rapid move in markets over March has caught many investors by surprise, even those who expected a negative fallout due to the emerging COVID-19 pandemic. While the crisis is unprecedented, the steepness of the market move left many with no opportunity to react. This is not the first bear market in history, but this has been the sharpest repricing the market has ever seen. The chart alongside shows the move in global and U.S. equity indices from their peaks and how many days it took to bottom out in different bear markets. The red line shows the current episode starting in February 2020.
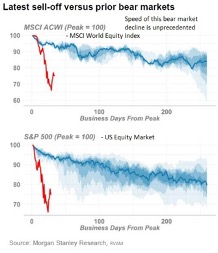
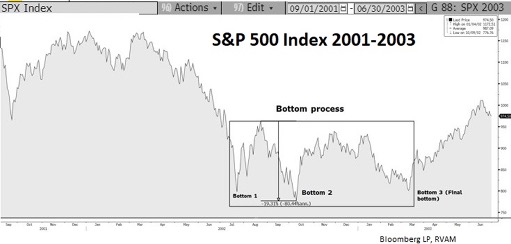
While markets have bounced off their bottoms, we think there will be more volatility and testing of lows before we get back to normality. Looking back at previous bear markets we see repetitive patterns – whether it was the bursting of the dot-com bubble in the early part of the last decade (2000-2003) or the GFC in 2008. In each of these occasions, after the sharp initial sell off, we saw bear market rallies and then a retesting of new lows as the market started pricing in actual earnings impact from economic events which preceded the decline. And these swings can be large. The chart below shows the extent of the swing in the S&P500 index during the bear market of 2002. From peak to trough we saw multiple retracings of nearly 20% in terms of index performance. 2008 charts show a similar trend.
The Three Phases Of Price Discovery
Financial markets go through three phases in a crisis while discovering the right price for assets:
- Phase 1: Market liquidity problems and stabilisation. This started in the middle of March and is slowly easing out now. In this phase, there are just sellers and no buyers for most assets. The price discovery mechanism breaks down for a period.
At the ground level, examples of this are forced selling of assets by leveraged investors with margin calls, selling by funds with redemption pressures holding illiquid asses, ETF outflows, hedge funds being forced to sell to manage risk, etc. This short-term problem can create long term damage unless a buyer of last resort steps in to clear the market and set a floor on pricing. This is exactly what happened when the Fed stepped in, supplying USD liquidity and becoming an aggressive buyer of credit assets, initially at the safer end of the credit spectrum and finally at even the riskier end. Though the extreme volatility in this phase has faded, it will take some more time for full stability to return.
- Phase 2: Near term business issues and solvency questions; differentiation begins.
This deterioration in economic outlook has stressed all businesses, but some more than others. For some, the stress on liquidity has turned into a question mark on their solvency. Simply put, this means that a three-month sudden stop in business activity for some businesses will be fatal. They will disappear. The market will now start looking out for such businesses and treat them differently than the rest of the corporate world. In the long-term, life will go on, but you have to be around for the long term. The survivors will gain market share and potentially offer higher returns for investors. But the challenge will be to differentiate the survivors from those which are likely to die.
- Phase 3: Market starts focusing on the new long-term equilibrium and growth trajectory.
This is where the bulk of the investment effort over the next few months should be. Markets will realise that some sectors will change immediately and permanently. A few might not change but will take a long time to normalise. Many will have no long-term change other than the impact of the next few quarters. And finally, a few will come out of this crisis much stronger. The game is to be able to slot various businesses into these baskets and then see whether we want to hold or buy them at the current price. This is where the solid long-term returns will be generated.
Impact Of Low Rates And Fiscal Stimulus For The Long Term
Coming out of this crisis, rates are certainly going to be low for longer than most people expected even two months ago. With the world operating below optimum capacity utilization for a reasonable period, the impetus for rate rise has diminished dramatically. Also, fiscal spending is going to be ramped up with lower focus on inflation in the near term. As growth normalises, this will obviously lead to inflation – first in asset prices and then in consumer prices. This is a big positive in the medium term. Obviously, the purists will worry about stagflation, some about hyperinflation, but given the crisis globally, these are points to consider once we stabilize the pandemic.
Valuations
What we have discussed so far is analysis, prediction, hope, fear, etc. But the one key fact in markets is the price at which you buy an asset today. Prices have come down, quite a lot for some assets to make them very cheap based on their history, a bit for others making them more reasonably priced compared to a few months ago. If economies recover quickly, prices we see today will look like a steal, looking back a few years from now. On an aggregate basis, the global indexes fell 25-35% from the peak to the trough of 2020, though some of them have recovered parts of this drop. If you include the drop in currencies, the USD drop in some of the markets is still quite large. Our view is that valuations will slowly normalise as the market gets more certainty on the multiple unknowns driving the uncertainty today.
The Perfect Storm
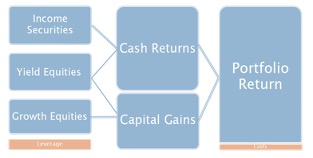
Many of our investors would be aware of the three-basket approach that we use for investing, where our security selection is spread across three broad asset classes: bonds, yield equities/REIT’s and growth equities. This approach not only gives us a good blend of income and growth but also provides diversification whereby different asset classes deliver returns over varying time horizons. This was historically visible in the low volatility which our portfolios exhibited. March 2020 turned the thesis upside down – though we believe this is only in the short term – given the unprecedented “perfect storm” conditions that we witnessed. As liquidity evaporated in the world, correlation across all asset classes increased and we saw significant drawdowns even in defensive assets.
A priori, we were not surprised by the decline we saw in equity markets though, as mentioned earlier, the steepness of decline over a short period was surprising. By the end of February, we had reduced our net leverage in the portfolio and reduced our equity exposures.
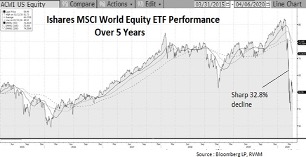
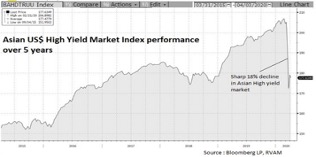
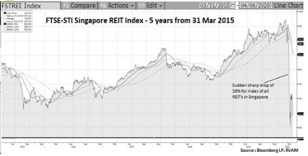
What really caught us by surprise was the concurrent fall in the bond market as well as REITs in Singapore. As the fourth chart on the bottom right above shows, the 38% drop in an asset class (REITs) which is backed by real assets with stable and visible cashflows was completely unexpected. While uncertainty hits every financial asset, the technical issues underlying the liquidity situation in the Singapore REIT market was a first and one of those unknown unknowns which we recognize only when an event like this happens.
Our Strategy Going Forward
Our base case remains that the COVID-19 situation peaks out in the next month or two and economies start reopening slowly – from April in China, while the rest of the world starts picking up from May-June. This would lead to a slow business recovery over the next few quarters. With this backdrop, our first action was to clean up the portfolio and move away from companies with potential for permanent damage to their businesses. The second step is to look at buying assets which have a high potential of reaching a normalised business environment within the next 6-18 months. Obviously, the longer the outlook on time to normalisation, the lower the current value and the higher the expected return and risk. Lastly, we have also created cash in our portfolio which we hope to keep deploying nimbly as opportunities arise through this volatility.
Our strong suggestion to clients is to stay invested. This is not the time to create maximum cash and go risk averse. We agree, given the trauma of the past month, the instinct is to sell and preserve cash. But simple logic and investment experience tells one not to create maximum cash after a large fall when assets are the cheapest they have been in a long time. The markets will continue to be volatile and can have another leg down as they will be short-term news dependent; on this we have no visibility. But that does not take away from the fact that when things normalise, the returns from today will be higher than the long-term returns from similar assets.
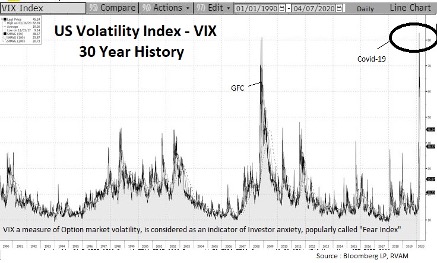
The chart above shows the trend in the VIX Index, a measure of option market volatility in the U.S. Many market observers consider this as a good proxy “indicator of fear” in financial markets. While the market has its regular burst of optimism and panic coinciding with greed and fear sentiments, the speed of the shift from optimism to panic was rapid in March. As we can see from the chart, in the middle of March 2020, VIX exceeded the level we saw during the Global Financial Crisis in 2008.
The good news is that the VIX index is also falling as rapidly as it rose, having retraced back to 40 by Easter. History tell us that the best time to invest is when there is a lot of fear in the market. But we are in unusual times. As we wrote in our last monthly write-up Scourge of the Infodemic, the best strategy in this environment is to focus on cashflows and avoid companies which have excessive debt. Time is a friend of patient investors, but one needs to be solvent in order to capitalize on the opportunities.
End
Disclaimer
This material is not intended as an offer or solicitation for the purchase or sale of any financial instrument. Information has been obtained from sources believed to be reliable. However, neither its accuracy and completeness, nor the opinions based thereon are guaranteed. Opinions and estimates constitute our judgement as of the date of this material and are subject to change without notice. Past performance is not indicative of future results. This information is directed at accredited investors and institutional investors only.