This month we would like to explore an interesting thought on long term hard currency returns from relatively risky assets. The thought came from a message forwarded to me by a good friend of mine. This is a message extolling the value of investing in stocks in India over investing in property for the long term. But we came to some additional interesting conclusions.
The data consisted of returns on three iconic properties that were bought between 1963 and 1981 in Mumbai (then Bombay) and sold in the recent past. This was compared to the total return from the Sensex since 1981.
The four examples are:
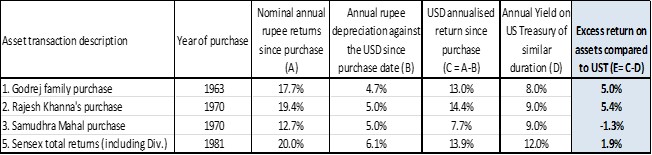
- In 1963, the Godrej family (one of the oldest industrial families in India) paid Rs. 100,000 to buy a 2916 sq.ft. apartment at Usha Kiran, Carmichael road, in tony South Mumbai. They sold it in 2011 for Rs. 250 mln. Money multiplied 2500 times over 48 years i.e. an annualized return of 17.70%.
- Film actor Rajesh Khanna (the first superstar of Bollywood) bought a bungalow in iconic Carter Road in Mumbai for Rs. 350,000 in 1970. His heirs sold it recently for Rs. 850 mln. The property has multiplied by 2428 times i.e. an annualized return of 19.38% over 44 years.
- Samudhra Mahal in Mumbai is another expensive property. A flat purchased in 1970 at Rs. 700 per sq.ft. was sold at Rs. 118,000 per sq.ft. in 2013. Money multiplied by 168 times in 43 years. This works out to an annualized return of 12.66%.
- The BSE Sensex has given a total return (including dividend) of 20% p.a. since 1981.
We have done a few things with these numbers to come out with some interesting conclusions.
a. Firstly we have tried to see the USD return from these same assets (and not rupee returns). This includes a phase of fixed exchange rate for the Rupee all the way till the late 1970s and a more market driven exchange rate only after India opened up in the early 1990s.
b. The second thing is that we have compared this USD return with what would be the total return from a US Treasury (UST) of a similar duration. For the 1963 transaction we have used the prevailing UST 30 year rates and added 2% to it (as the holding period of this asset is 51 years) and for the 1970s transactions we have taken the prevailing UST 30 year rates and added 1%. For the 1981 transaction we have just used the prevailing UST 30 year rates at that time.
The interesting observations are:
- Nominal returns are high: The nominal annualized rupee returns on these assets are huge (column A). The multipliers also look huge. This is the power of compounding.
- Nominal USD returns are lower: However, this was in a high inflation environment. This is reflected in the rupee depreciating consistently over this time frame. Hence the USD returns on these assets are lower. But they are marginally better than the total return from the Dow index over similar time frames.
- Relative to risk free rates these are mediocre returns: Most importantly these returns do not consistently outperform returns from USTs of similar duration. The outperformance is between -1.3% and +5.4%. Also, the large outperformances are for purchases done when India was a truly closed economy and a much higher risk investment product than a US Treasury.
We have used this range as indicative of the potential return over risk free rates. If we look at today’s 30 year UST return of 3.2% and use these range of excess returns we can conclude that the USD forward returns from now are going to be between 1.9% and 8.6% per annum for an asset with a duration of 30 years.
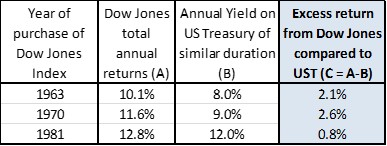
If we were to do a similar analysis with total return from the Dow Jones index (and not these set of India property and equity assets) the conclusion is not dissimilar. The excess returns are between 0.8% and 2.6%. Hence the expected range of forward total returns using this analysis is +4% to +5.8% p.a. over the next 30 years.
This is a relatively simple, back-of-the-envelope analysis but the conclusions are powerful. Future returns from most asset classes will struggle to reach high single digits. This is consistent with what we have been reiterating during the past 18 months and with our current investment philosophy.
End
Disclaimer
This material is not intended as an offer or solicitation for the purchase or sale of any financial instrument. Information has been obtained from sources believed to be reliable. However, neither its accuracy and completeness, nor the opinions based thereon are guaranteed. Opinions and estimates constitute our judgement as of the date of this material and are subject to change without notice. Past performance is not indicative of future results. This information is directed at accredited investors and institutional investors only.