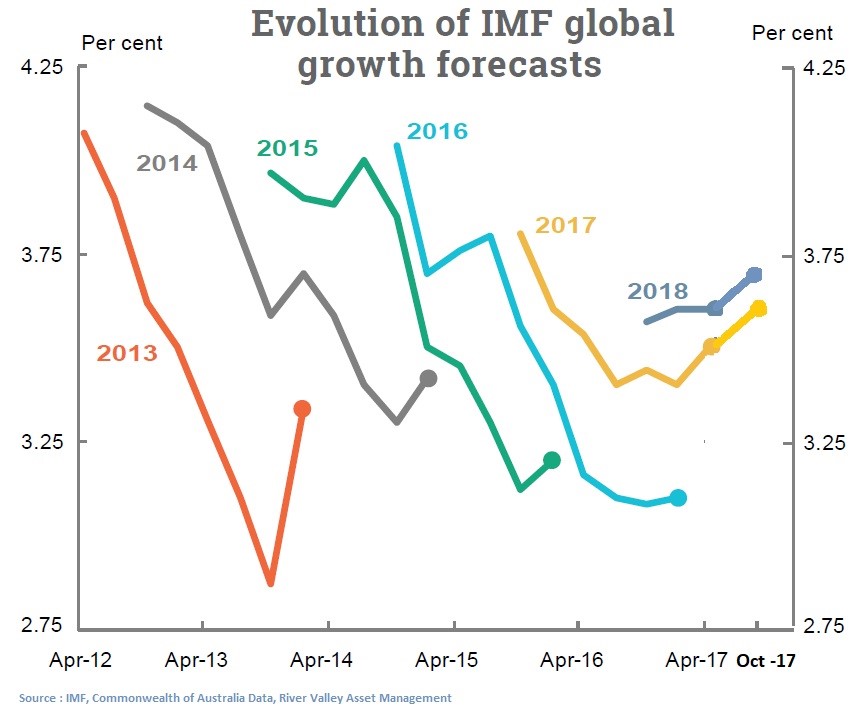
In October 2017 we got the IMF’s latest assessment of the global economy and it was an upbeat report. After years of global economic activity undershooting expectations, we saw the second upgrade of the year for global growth outlook. While the upgrade was broad-based, there were two notable countries where numbers were cut – India and the USA. We wrote about India in our last monthly piece “Storm Alert” and we will focus on the US this month. The IMF also cautioned on the fragility of activity, highlighting risks from high asset prices, persistently low inflation (due to deleveraging), global political uncertainty and continuing imbalances in China.
Global Growth is Synchronised and the Highest in 5 Years – Expectations are Now High
The world economy has been growing at about +/- 3.25% trend line for a number of years now, weighed down by deleveraging in developed markets on the one hand and a slowdown in emerging markets brought on by adjusting to a lower commodity intensive phase of growth in China, as focus there shifted towards consumption.
Growth was helped by unprecedented support provided by monetary policy, with the major central banks resorting to Quantitative Easing, lower-for-longer interest rates and near zero cost of capital.
The good news is that maybe for the first time in a decade we are seeing signs of synchronized global recovery with every major region showing PMI indicators which point to strengthening growth. After starting 2017 with caution, the IMF has now upgraded growth expectations twice and in the recent round to 3.6% for 2017 and 3.7% for 2018. Europe and Japan are normalising post multi-year lows driven by accommodative domestic policies and improving global demand for their exports. Chinese authorities, after policy missteps in late 2015, seem to have regained control and are managing their economy towards a softer landing, while a recovery in commodity demand and prices is helping other emerging markets come out of the deep recession some of them faced.
While each of the drivers of the normalisation of global growth is apparent, unfortunately none of them looks structural and sustainable in the long term. Our fear is that the trend growth will go back to the lower number of the past few years as these factors reverse.
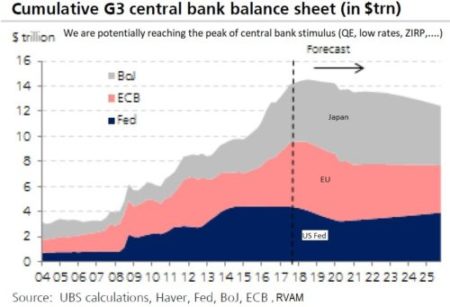
Strong Central Bank Balance Sheet Expansion is Running out of Steam
The central bank balance sheet expansion – Quantitative Easing – has been one of the largest drivers of growth in the past few years.
After nearly a decade of accommodative monetary policy (since the Global Financial Crisis), we are coming to the end of Quantitative Easing with central bankers starting to look at how to normalize their balance sheets. The US Fed is first off the mark with its slow and gradual unwinding which started last month just when the IMF was upgrading its outlook. We expect the ECB to follow through with its plan in 2018 followed by Japan once they hit their limits. Central banks have been cautious in the pace of withdrawal plans but the size of their balance sheets ($14tr in a $78tr global economy) present challenges as this round of unwinding will be unprecedented with very little parallels in history. A policy error could easily stunt the nascent global growth recovery. Too slow a withdrawal could prolong asset bubbles while a faster one could tighten financial conditions, way before a sustainable recovery takes hold. The US is facing that challenge.
The Sustainability of US Growth
This is the crux of what will drive asset returns over the next few years. Here we highlight three separate points which help see the overall mosaic more clearly. The three points are: the very flat US yield curve which normally is a sign of an imminent recession; the fact that we are now in the second highest continuous expansionary stretch in US GDP in the past 150 years; and, finally, the very weak growth in US GDP if the energy sector is not considered.
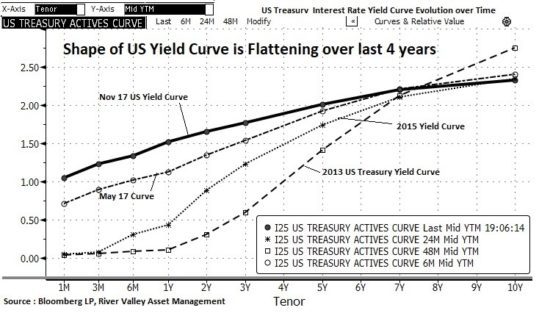
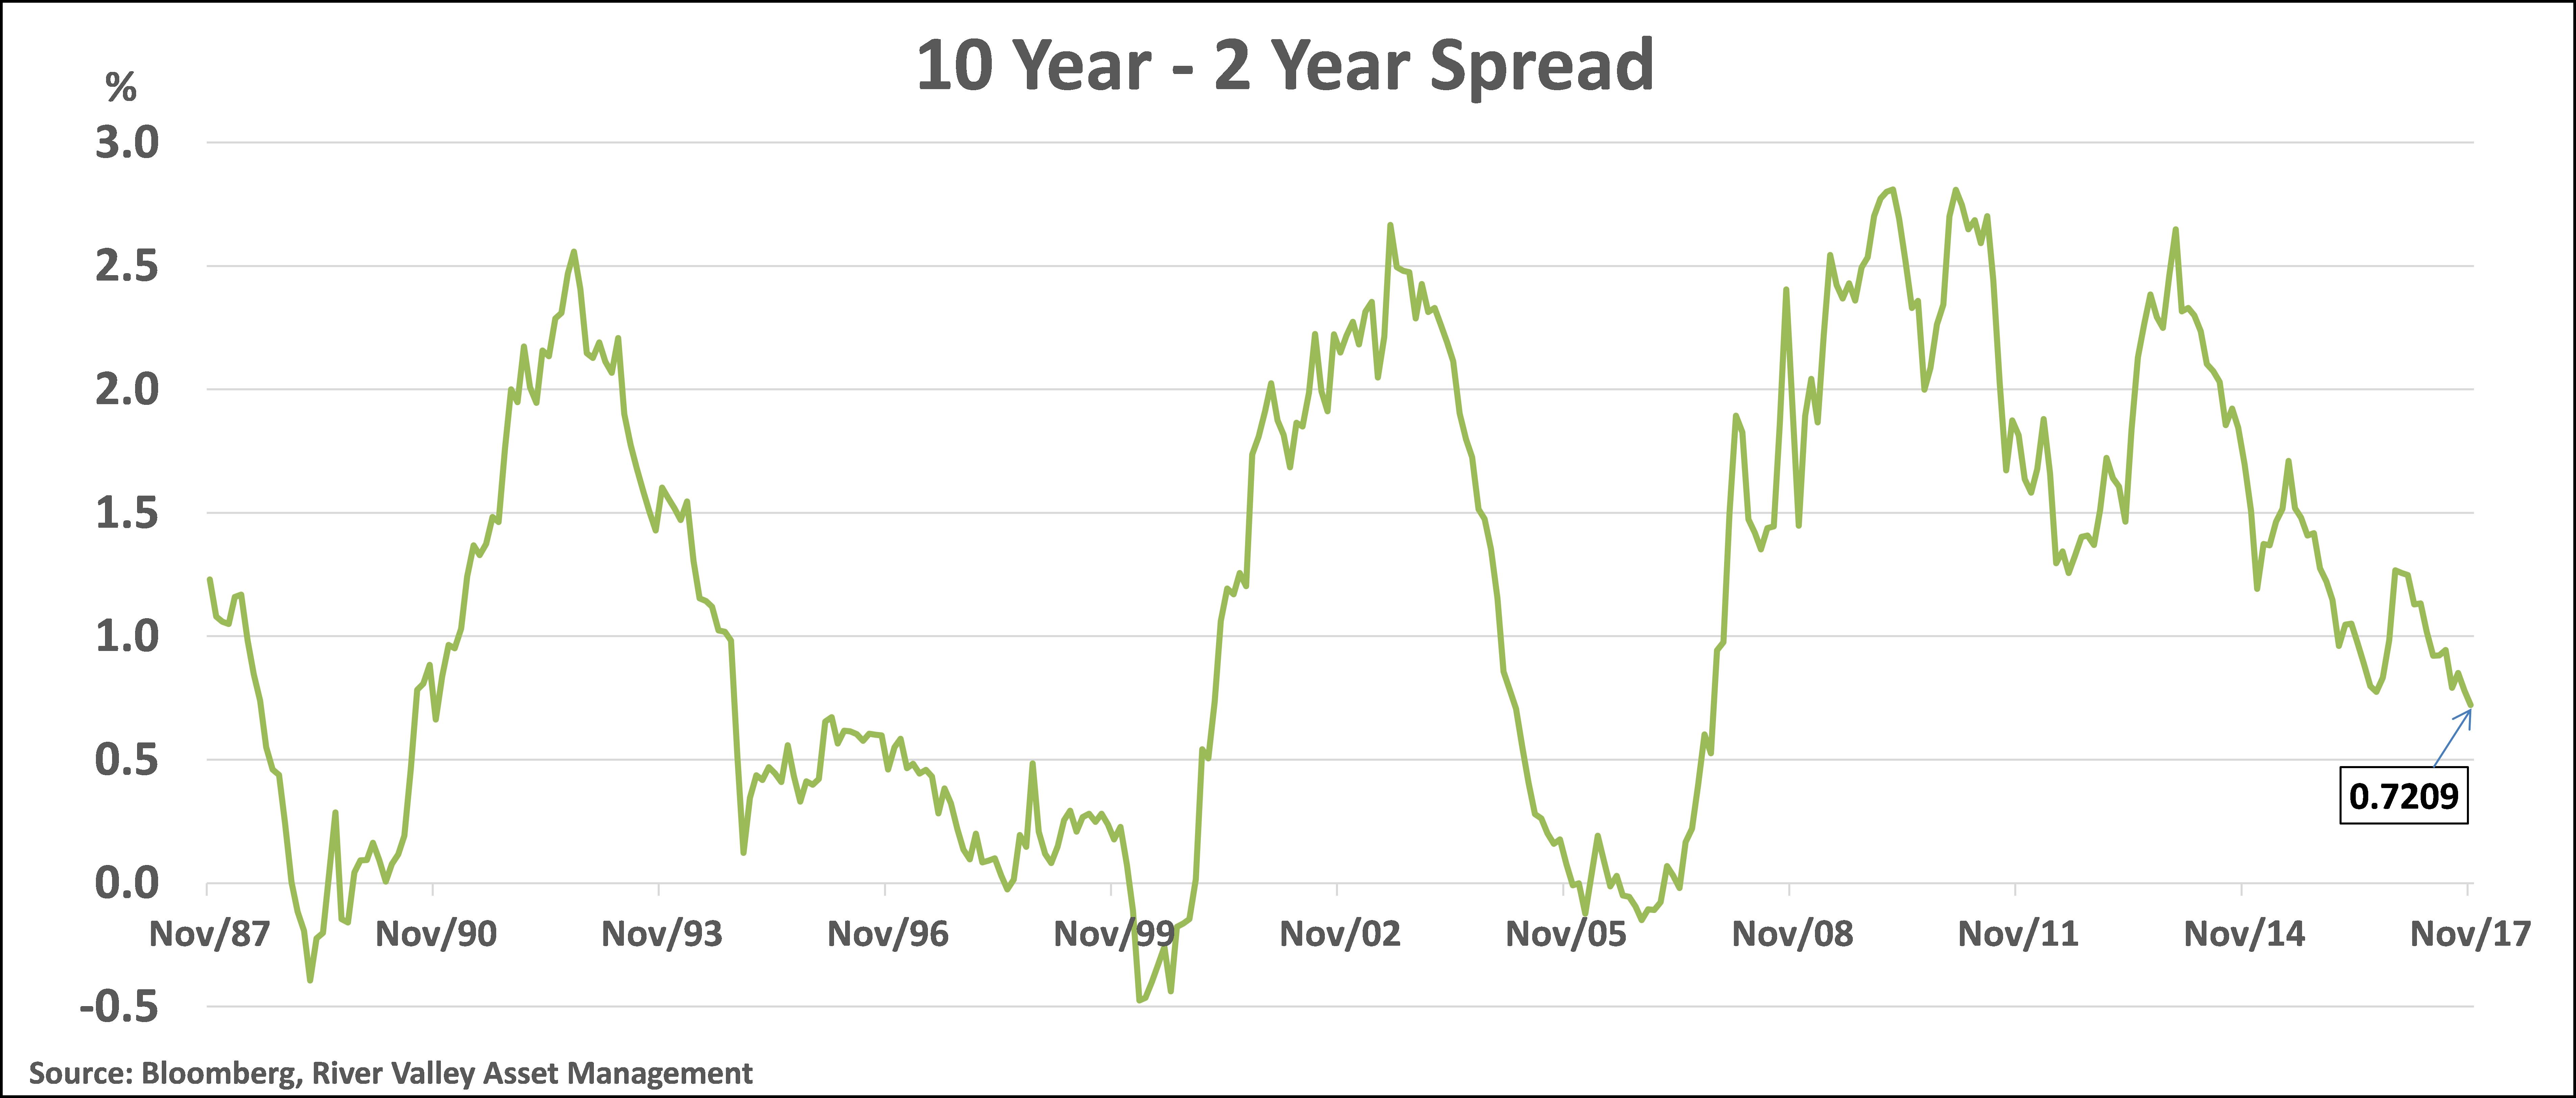
The Flattening Yield Curve
This is defined as the spread between the US 10-year yield and the US 2-year yield. Historically (for the past 30 years) this fluctuated between 0-2.5%. It has only gone below 0% for a few months at the peak of the dot com boom in 2000 and at the high of 2007. This metric has been a relatively accurate predictor of future returns when it reaches the extremes of the quoted range, with 0% being a strong sell signal and 2.5% a strong buy signal. Historically, a flat or inverted yield curve has always heralded a future slowdown/ recession. We are currently at 0.72%. With a Fed rate hike imminent in Dec and two further hikes in 2018, this number could be nearer 0.5% by January 2018. This clearly qualifies as euphoric territory. The one thing that can prevent this is the US GDP growth being strong enough to let 10Y rates move up by an equal or larger amount. But we are not sure this is going to happen (we will elaborate this later). The second way this can be prevented is by the Fed stopping the rate hike cycle – but no one expects that and it would be a shock to the market if it happens.
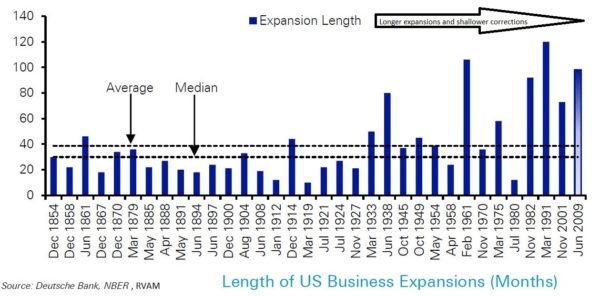
Silver-Haired Expansion Cycle
We are currently in the second longest GDP expansion cycle the US has seen in the past 150 years. The only time we had a longer expansion was in the 1990’s, a period of strong productivity growth (unlike the current cycle where it is weak). Expansion cycles build up excesses, hubris and high valuations. This increases the probability of mistakes occurring at all levels – the central banks, corporate decisions, investor risk appetite, etc. Hence, the need for caution increases.
One potential source of a mistake is a longer than required Fed tightening cycle. With a tight labour market, the Fed may be forced to increase short term interest rates if inflationary pressures raise their head even if there is slack in some parts of the economy. President Trump’s “America First” tough immigration policies without follow through on reforms in other areas may worsen the tight labour market. By historic standards we are already in the mature phase of this business cycle in the US, if measured by the length of the cycle.
Weak GDP Growth (ex The Energy Sector)
The other trend in the US which worries us is the narrowness of growth drivers. While GDP growth rebounded in 2017, it was not widespread across sectors. The first indicator of this was when a few of the companies which we are invested in showed poor numbers in the US while their businesses in the rest of the world surprised positively. This contradicted the signals one gets when looking at aggregate GDP trends. We recently came across a good analysis of the US economy from UBS, which potentially explains this conundrum. The chart alongside shows the headline GDP growth in the US, the contribution to GDP from the energy sector and from the rest of the economy excluding energy. With oil prices recovering strongly this year, energy-related investments in shale oil and its related ancillary support industries seem to have contributed nearly 60% of the growth pick up in 2017. If we strip it out, the rest of the US economy seems to be growing at only 1.03%, a shockingly low number.
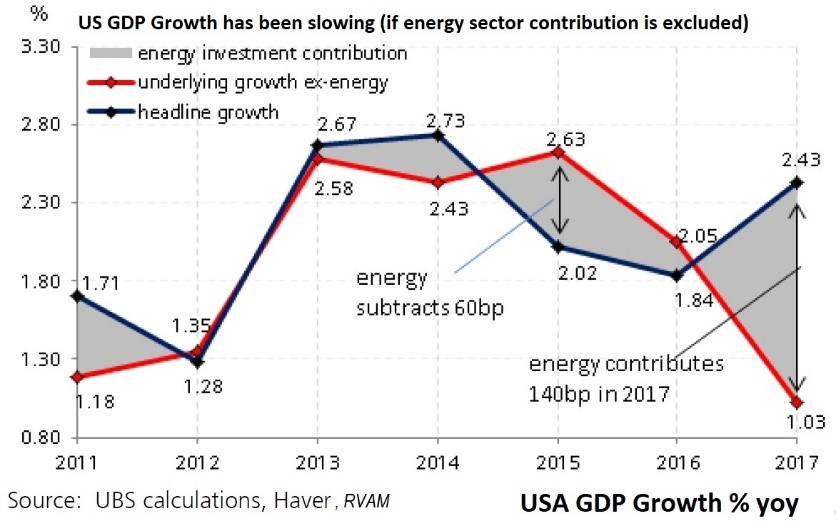
What is worrying us more is the trend of underlying (ex-energy) growth. It has been decelerating for two years now. The year started off with high expectations by the market on growth recovery in the US, driven by potential policy actions of the Trump administration, but the follow through has been weak, though hopes still linger with tax reforms making their rounds of the Capitol. If this initiative also meets the fate of other bills in the real world of Washington politics, we would not want to hang our hats on volatile energy being the driver of US growth in 2018.
Conclusion
The strong synchronised growth recovery of 2017 is primarily driven by non-structural forces – a strong rebound in cyclical sectors off a 2016 low, temporary Chinese growth acceleration in a longer term slow deceleration and stabilisation of financial risk after many years of forced deleveraging. This has created scepticism in our mind vis-à-vis global growth expectations over the next 12-24 months.
In this context the strong global stock market rally (proxied by S&P 500 or Dow) of 2017, is highly susceptible to this lower than expected GDP growth. To be honest we do not see extreme excess all around like it was in the 2000 and 2007 peaks but we do see enough signs to be cautious and keep our risk management antennas up. Our portfolio reflects that in terms of our net exposure level.
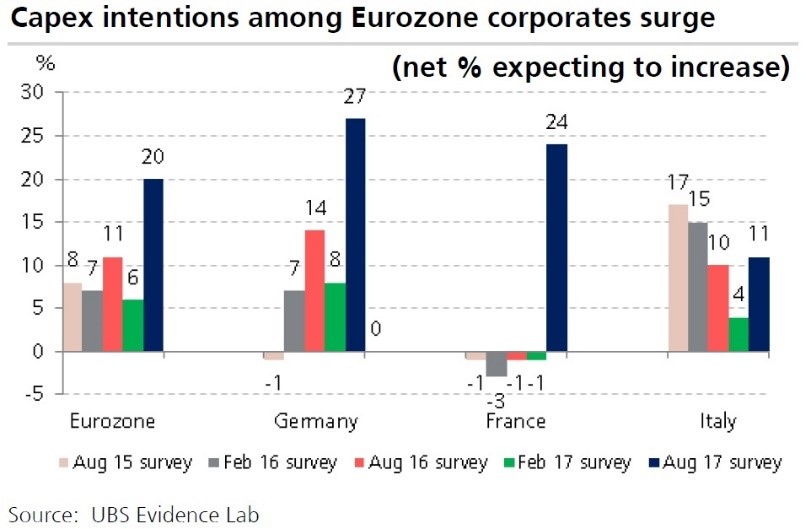
While the US has its challenges, over in Europe, despite the lingering Brexit noise, things are looking rosy. With major election cycles behind us, growth is surprising positively; the macro situation is stable with the region running current account surplus north of 3% and most major countries getting their fiscal situations under control. The contingent risk from potential failures of weak South European banks seems to be have been managed well with a few of them going for resolution without any contagion over the last 6-9 months. The ECB has telegraphed its intentions of keeping monetary policy as benign as possible for as long as it can. All this is finally showing up in rising confidence across boardrooms in the Eurozone as corporates get confidence to start investing again. The chart alongside shows survey results from UBS which highlights the rising percentage of corporates looking to increase their capital expenditures.
Turning to Asia, Abenomics supported by BoJ policy is helping the Japanese economy deliver its seventh straight quarter of growth, a feat last achieved in 2001. Growth in China continued at a steady pace as authorities focussed on stability in the year of political transition. Going forward, we expect the economy to be stable but growth to moderate as authorities focus on fine tuning President Xi Jinping’s new era vision of an advanced Chinese society away from excessive focus on numeric growth targets at any cost. Transitions are always fraught with risk, but the authorities seemingly have the tools to manage it. Going into 2018, at some point we will revisit the Chinese economic outlook as pieces of the China puzzle fall into place. With China incorporating its outbound Belt & Road Initiative as a key policy in the just concluded 19th National Congress, we see ASEAN as the biggest beneficiary of the next round of investments in Asia as Japan and China (the two capital surplus economies in the region) vie for an action of the economic pie as well as for political clout within the region.
As we reach the final stretch of 2017, the global economic outlook looks bright, but markets are trading at all-time highs, optimism abounds but plenty of risks loom on the horizon. We continue to see good bottom-up opportunities which gives us confidence to stay invested but at the same time be wary of risk from contagion.
End
Disclaimer
This material is not intended as an offer or solicitation for the purchase or sale of any financial instrument. Information has been obtained from sources believed to be reliable. However, neither its accuracy and completeness, nor the opinions based thereon are guaranteed. Opinions and estimates constitute our judgement as of the date of this material and are subject to change without notice. Past performance is not indicative of future results. This information is directed at accredited investors and institutional investors only.