This month we are going back to Jeetu Panjabi, our regular guest contributor. Jeetu has a valid and interesting insight on how the global nominal GDP growth had slowed down since 2012 and was quite negative in 2015. This is expected to sharply rebound in 2016. This number is important as the corporate revenue we see is related more to nominal GDP than to real GDP. Also, nominal GDP growth helps economies to deleverage as absolute leverage is a nominal number. This rebound is a potential source of positive corporate revenue and earnings growth in the coming year.
Honey, I shrunk the World by $5 trillion in 2015!
I have heard a lot of portfolio managers internationally in recent months articulate that 2015 has been a very tough year with the macro being a mess globally, without being able to point out the reason for it. MSCI World in 2015 was down 2% and MSCI EM was down 15%, feeding their point of view. The dilemma is accentuated by their inability to look through the mess and find a path out of this chaos. I feel that the markets need to look at a different set of metrics to explain what is happening. Looking at the Linkages between Macro and Markets, I take a stab at explaining this and conclude with my optimistic view for 2016 on the World and Markets. Looking through the conventional lens of World real GDP growth for 2015, it should have felt like a reasonable year as the World in real terms grew at 3.1% v/s 3.4% in 2014. The Developed World grew around 1.8% with the Emerging World growing at 4%. Well, then why did it feel so bad?
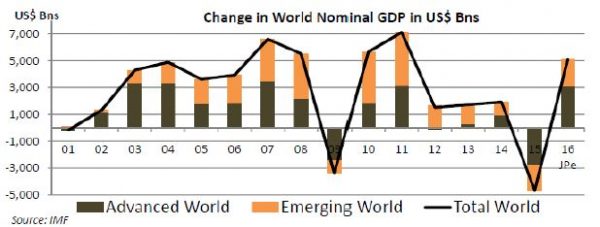
The answer lies in looking at the Nominal World GDP which shrank from US$78 tn in 2014 to US$73 tn in 2015. This was while World GDP still grew at 3.1% in real terms. The real culprit was a combination of the ‘World deflator’ collapsing and the US$ rallying, which together resulted in a World that shrank by US$ 5 tn or by about 6% of its size. The Developed World accounted for two thirds of this shrinkage, while the Emerging World accounted for a third of it. This was similar to what happened in 2008, when the world shrank by US$ 3.4 tn or about 6% of its size to just under US$ 58 tn. The difference between 2009 and 2015 is that the World GDP was negative in real terms in 2009, while the world still grew at over 3% in real terms in 2015. The chart above explains this picture attributing the shrinkage between the Developed and the Emerging World. At a country level, for example, in 2015 India grew at 7.3% in Real terms and 2.3% in Nominal US$ terms, and similarly South Africa grew at 1.3% in Real terms, while in US$ terms it shrank by 10%. In my view, this phenomenon is reversing in 2016 with World GDP expected to grow by 7% or about US$ 5 tn to US$ 78 tn, using the IMF 3% real growth estimate with my guesstimate on the ‘FX+Deflator’ impact of 4%. This clearly makes the world look like a much better place relative to the expectations of most people I have met.
Next, we move to the question of what drove the collapse in the world deflator and potentially the US$ rally last year – one word, CHINA. China has been structurally slowing its growth trajectory over the last five years driven by a normalization in potential growth as savings rates moderate, essentially driven by demographic headwinds. In 2015 they went through an added dimension of a cyclical slowdown driven by a mix of policy steps and miscommunication leading to market panics. This drove down the commodity complex globally hurting Emerging World countries like Brazil and South Africa, and countries like Australia along with their respective currencies. The safe haven in the middle of this panic was the US$, which rallied hard especially against the commodity currencies. This was also partly catalysed by a weakening in the Chinese RMB in August 2015 as a step in the SDR accession, being construed by markets (due to a lack of proper communication) as the first step
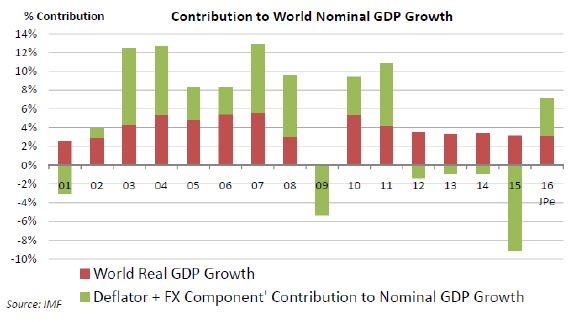
to potentially significant weakening because their economy was in trouble. All of the above resulted in crude oil collapsing to under US$ 30 levels towards the end of 2015 and the commodity complex (S&P Commodity index) broadly down 25% in 2015. The US$ (DXY) in 2015 was up 9%, with currencies like the Brazilian Real down 33% and the South African Rand down 25% v/s the US$. All of the above resulted in the ‘Deflator+FX’ component of Nominal World GDP growth falling about 9% as we see in the chart above. Currently, we can see both of these metrics already reversing with the US$ weaker by 5% year to date and the commodity complex up 19% year to date. This is built into my guesstimates leading to World GDP growing at over 7% in 2016 as can be seen in the chart below. This in turn is a fuel for corporate earnings and asset prices globally. The lesson clearly is that we live in a ‘Nominal Dollarized World’ and a marginally softer US$ is conductive to World growth and asset prices globally in general.
We now ask the next question of how negative Nominal GDP growth rates feed into earnings and equity markets. The answer really lies in the fact that a shrinkage in the World GDP in US$ hurts global demand for goods in both volume and price terms and this is a headwind for revenue growth for the corporate sector. This is also deflationary for price growth for goods as the commodity chain collapses resulting in pressure on the profit pool. A case in point would be a ball bearing company having to cut prices of bearings as demand is weak and the raw material prices of steel too having fallen. This reduces the profit pool as the revenues of the company shrink while certain fixed costs eat into margins. As demand and prices recover with a lag over the next few quarters, we see a reversal in these trends driving our thesis to be constructive on profits.
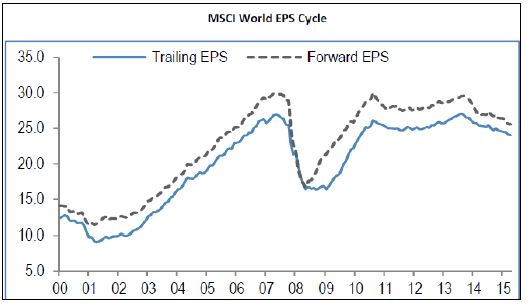
If we look at the chart above, we can see that global earnings collapsed in 2008, and the last 18 months have been a milder version of the same. In my view, the drivers for the profit pool of the corporate sector have visibly turned upwards, potentially driving up earnings and thus equity markets. The above analytical framework is one that does not make headlines or form part of macro briefings, but is extremely relevant for both investment and business decisions. I would believe that the next 9-12 months should set the pace for a normalized world from the shrinkage we saw in world output in 2015. This should be viewed in the context of normalizing of the world and not in the context of macro variables driving medium term growth beyond that. So, time to ride the wave for now and worry about what is beyond much later. A risk to this thesis is event risk like Brexit or implications of a Trump victory in the US presidential elections. However, I feel very convinced that the overriding macro variable for the World would be the one I have talked of above.
End
Disclaimer
This material is not intended as an offer or solicitation for the purchase or sale of any financial instrument. Information has been obtained from sources believed to be reliable. However, neither its accuracy and completeness, nor the opinions based thereon are guaranteed. Opinions and estimates constitute our judgement as of the date of this material and are subject to change without notice. Past performance is not indicative of future results. This information is directed at accredited investors and institutional investors only.