The talking point at the start of the year was ‘bubbles’ popping up in different parts of the market. In parallel, the cacophony caused by the GameStop episode, RobinHood investors and the shenanigans of a motley bunch of celebrity hedge fund managers-turned-evangelists, raised a din so loud, it obscured and drowned out the signals coming from the gentle yet surely changing tide in the bond markets. Before long, this quiet turn gave way to a sharp acceleration of the super-tankerish 10-year U.S. bond yield and U.S. 10-year breakeven inflation rates, just as the GameStop soap opera ratings were petering out.
On the day after Valentines in February, investors on Wall Street (or wherever) and realised that they had a sudden change of heart. Blame Cupid, stupid? The old flames had begun to flicker away and dim while new ones were being kindled. The narrative changed quickly. The unglamorous 10-year bond yield was now the cynosure of all eyes. What had just happened? It was beginning to dawn that everything had just changed!
Lo and behold, the chart that everyone was transfixed by – the U.S. 10-year bond yield – had just jumped 8.25% on 16th February! Yes, the 10-year was kicking and rearing from that day like a bucking bronco! Interest rate plots and Fed speak, inflation and policy rate forecasts became stale overnight and went into the trash bin.
The rapid vaccinations across the U.S. raised hopes for a sharp drop in social distancing measures and a reopening of the economy which, it was expected, would lead to strong increase in demand for goods and services in time for summer. Expectations turned on a dime that the reopening of America would generate powerful consumption forces and cause labour demand to grow strongly. Elsewhere too, as vaccination programmes gathered strength gradually, it was felt that global industrial production growth was set to accelerate, fuelled by low inventories and strong business investment.
The outcome of all this would have a bearing on inflation measures globally which, it was felt, would surely rise significantly by summer, partly due to YoY base effects, but also due to ongoing supply issues and financial services inflation (in the U.S.), and a likelihood of services sector price increases as social un-distancing drives up demand faster than supply can follow. This was discussed in our February newsletter: Commodities Signal the Inflexion of Inflation.
The passing of the US$1.9tr package more-or-less in full eventually (some had expected it to be significantly pared down) set the cat among the pigeons, driving the 10-yr further higher. Remember too that this is in addition to the $900bn COVID package signed by Trump in his final weeks in the White House. The surge in household disposable income due to newly sent cheques plus the estimated US$1.6tr of household savings would add up to a mind-boggling ~14-15% of U.S. GDP, most of which would be in the hands of people and possibly spent by September this year.
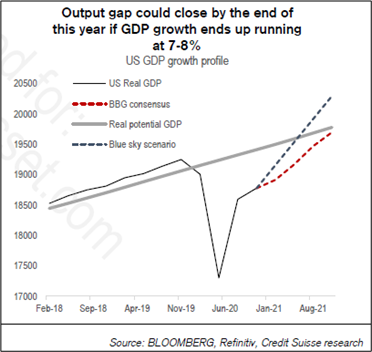
That sets the stage for the markets in the coming months. The trio of pent-up demand, record-low inventories and explosive income growth (via government transfers) is likely to close the U.S. output gap much quicker than anticipated, putting the Fed in the awkward position of having to lift its GDP, inflation and perhaps Fed rate forecasts.
What has not changed yet is the steadfast adherence of the Fed to maintain loose monetary conditions. Fed Chairman Powell spoke not once but thrice over the course of the month, choosing his words with utmost care yet firmly delivering the message that he was far from moved by the change in expectations. His goals of the economy reaching an average inflation rate and an absolute reduction in unemployment are some distance away yet, although ‘substantial progress’ had been made thus far. He viewed the upcoming inflation increase as being low-base driven and transitory.
However, the bond market is not fully convinced that is the case. The market now believes that ‘substantial progress’ is approaching even faster than expected by the Fed and that guidance on purchases this year is likely signalling reduced purchases by mid-2022. In an extreme case of stimulus-fuelled growth, plans to reduce purchases could be put into effect this autumn as per certain quarters of the market. There is also the not insignificant technical factor of massive multi-year fund-flows shifting away from bonds that could carry yields further and higher in time and magnitude in the weeks and months into summer.
Such a reckoning has slammed the brakes on the equity market rally. The Nasdaq Composite Index has taken it on the chin and the S&P and Russel 2000 have not been spared either. The spectre of rising interest rates is clearly anathema for many of the high growth technology and biotech stocks which have been riding this raging bull market on little or no earnings and specious valuation ratios to justify their valuations for many years. Even the poster boys – the FAANG stocks – could not withstand the selling that followed.
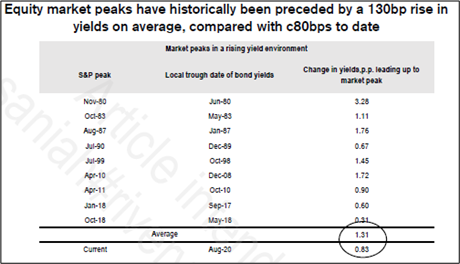
As per CS strategists, for equities, the problem historically is when the 10-year yield rises more than 130bp (which would mean rising to 1.9%). It impacts markets in four ways:
- The rise in the 10-year impacts equities via bond/ equity valuations
- GDP (1% on the TIPS yield could take 1.5% to 2% off GDP)
- Earnings (a quarter of margin improvement is from lower rates)
- Funds flow (gap between corporate bond yield and earning yield closes, so buybacks slowdown).
Source: Credit Suisse
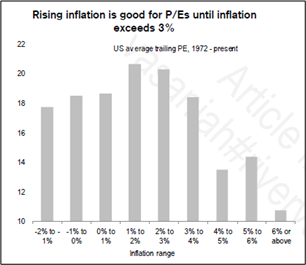
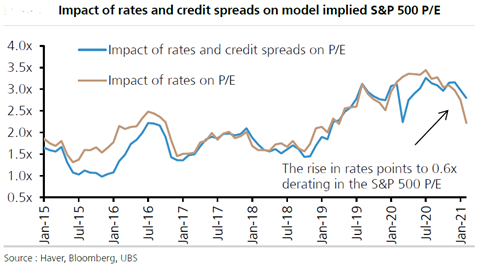
In short, the cocktail of rising inflation expectations and bond yields is a recipe for high P/E ratios to contract and lead prices sharply lower for such stocks. This is what is underway now. Based on this, while the Nasdaq100’s absolute decline is easy to explain, the S&P500 too has followed suit. The S&P500’s technology component (if one includes Amazon as a tech company) is now 42%, which makes this once broad-based benchmark a lot narrower than imagined. We note that equities are long duration assets and that rising yields and inflation beyond a tipping point will lead to P/E ratios contracting and stock prices giving up much of the gains of the bull market. This, combined with the S&P500 now being so tech-laden, has made it a veritable ‘duration monster’!
The speed with which the yield curve has steepened means not only that this is a decisive shift in the narrative but that the real growth in the economy is indeed about to inflect higher sharply in the months ahead. Inflation will spike owing to last year’s low base. And this is where it gets interesting.
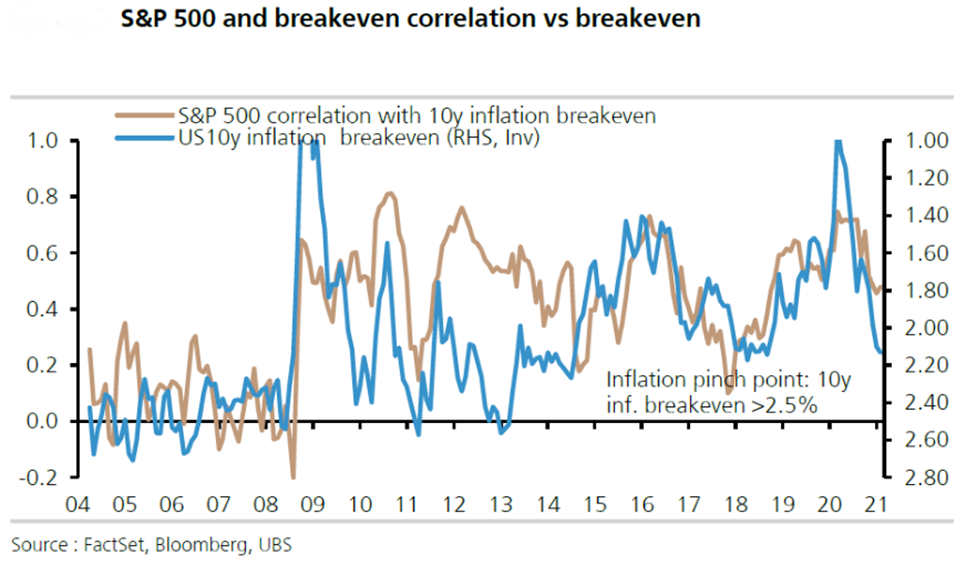
It will be crucial to see how the next two or three months leading up to ‘re-openings’ in the U.S., the U.K., Europe and the rest of the world play out, and how far bond yields will rise. Right now, the consensus has swiftly moved to the 2% mark for U.S. 10-year yields and zero for Bunds. It will be equally important to track the core PCE inflation to see where it ends up (expectations are for 2.5-3%) and how long it stays elevated.
For equity markets, a massive portfolio shift has been underway anyway since late into 2020. Technology stocks and ‘Work from home’ (WFH) beneficiary stocks have been under pressure and could remain so for some time to come. On the other hand, the dregs of the past – the financials and energy stocks – have made a strong comeback. Commodities continue to be the rage as the growth reflation theme gains further currency. The weak dollar and the change in growth expectations have helped Emerging Markets and Asia to come back strongly as well.
Real rate moves are likely to lead to further de-rating of high growth stocks in future. However, forward earnings expectations are likely to rise 20% or more over the course of the year. Thus, earnings could more than offset the rate headwinds through the course of the year. Over time, the inflection in spending and earnings could be a more important driver of stocks than just the rise in rates.
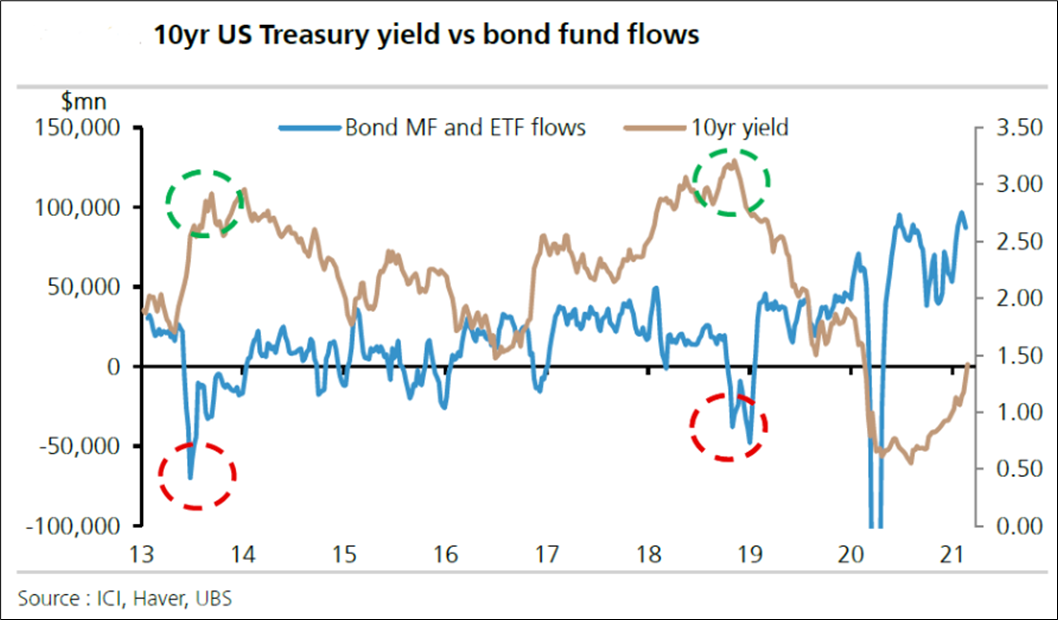
What we also need to watch out for are bond fund outflows. Rates kept rising in 2013 and 2018 until there was a surge in bond fund outflows. That phase is still to come and thus bond fund flows could put further pressure on rates as redemptions accelerate. Credit flows are key, given relatively less liquidity and the risk of greater spillovers to equities.
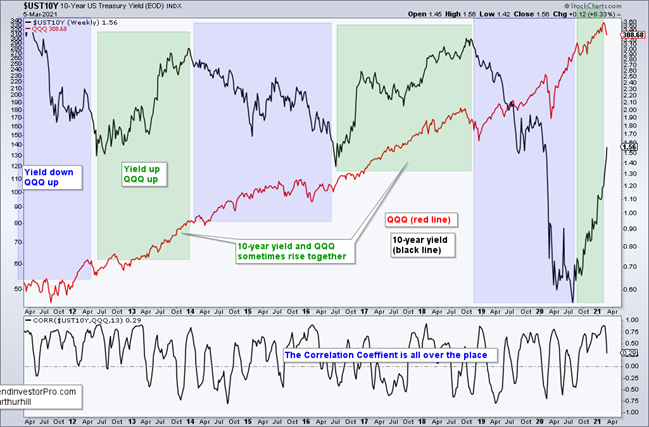
QQQ and 10-yr: A Love-Hate Relationship
Having said all the above, corelations such as the ones we are talking about today work differently at different times in practice. Take a look at recent history and the chart below. It shows the Nasdaq 100 ETF (QQQ) in red and the 10-yr yield in black. The green zones show when they rose together (positively correlated) and the blue zones show when they moved opposite each other (negatively correlated). The 10-year yield doubled in each of the three green zones and QQQ still moved to new highs.
Source: Stockcharts.com
The indicator window shows the Correlation Coefficient, which is an attempt to quantify the relationship between the 10-yr yield and QQQ. It is positive when they move in the same direction and negative when they move in opposite directions. This indicator is all over the place and it is hard to tell if there is a clear correlation either way. Sure, QQQ and the 10-year yield are negatively correlated over the last four weeks, but that does not mean they are always negatively correlated.
In sum, we note the following key points:
- The mind-boggling combined stimulus of ~14-15% of GDP over less than a year into the U.S. economy is likely to create all sorts of primary and secondary effects. These are proving to be a massive challenge to estimate for economists and the market just yet. GDP estimates and earnings estimates, while being driven up chunkily, could yet fall short when the actual numbers arrive much later. By then the stock market needs to work out how to price this in, keeping in mind the significant shifts happening with inflation expectations and real yields.
- S&P500 forward earnings are set to rise by 20%+ based on various forecasts. Compare that to 2013 when GDP growth was ~2.5% and forward earnings grew just 6.5%. The rally in 2013 was driven predominantly by the multiple going up 23%. This time, it is hard to make a case that the absolute level of the S&P500 would rise based on merely earnings multiple expansion.
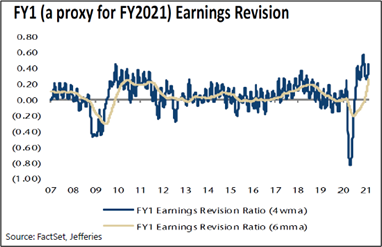
Source: Jefferies
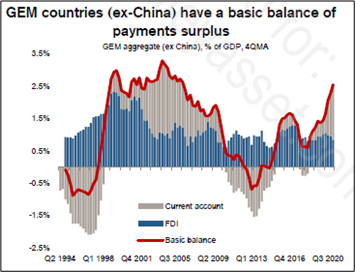
- For that to happen, we must now begin to see growth becoming more diverse and broad-based as the cyclical sectors of the economy catch the reflationary force-field in the economy and begin growing or growing faster than they have in the past. This time around, Emerging Markets should be less vulnerable to a rise in the TIPS yields because their basic balance of payments surpluses are close to a 15-year high.
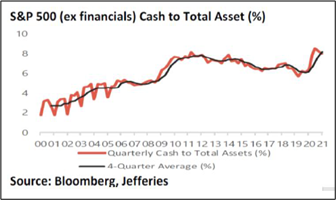
- U.S. corporations have plenty of ammunition on their balance sheets. As confidence returns, this cash can be used to kick-start a fresh wave of share buybacks, raise dividends and fire up M&A activity once again (see chart alongside).
- Finally, the correlation between technology stocks and bond yields is at best tenuous as we have seen over the last decade, which has been the golden period for technology stocks in history. While the current negative correlation might play for a while, it is not guaranteed that they would continue to underperform regardless of their own growth fundamentals. A more nuanced and stock-specific strategy is what might serve well from here on.
We will likely look back at 2021 as the watershed year when global growth finally took hold and began to flower after many fallow years. The markets will perhaps realise over time that the rise in yields and inflation owing to GDP growth was in fact a good thing after all and that the three could co-exist, just as they did through 2003-2008 before things overheated. The stock market will adjust itself to this change in economic climate, as it always does, with a few hiccups and convulsions along the way. Sector rotations are already underway and may continue strongly through the year as the entrenched tech bulls yield finally. Emerging markets and Asia are having their best days in a long time to the extent that some of their rallies look extended in the short run and could be due for a correction.
There is plenty for markets to think about and to price this spring and summer. Meanwhile, the verse from the 2013 Taylor Swift and Ed Sheeran ditty plays in our heads as we pen this…
And all I feel
In my stomach is butterflies
The beautiful kind, makin’ up for lost time
Takin’ flight, makin’ me feel right
.
.
.
All I know since yesterday
Is everything has changed
End
Disclaimer
This material is not intended as an offer or solicitation for the purchase or sale of any financial instrument. Information has been obtained from sources believed to be reliable. However, neither its accuracy and completeness, nor the opinions based thereon are guaranteed. Opinions and estimates constitute our judgement as of the date of this material and are subject to change without notice. Past performance is not indicative of future results. This information is directed at accredited investors and institutional investors only.