As we enter the third decade of this millennium, we look back over the last ten years, draw inferences from what transpired, examine where returns were generated and try to position ourselves for the years ahead. In this process we try to address one of the most common questions we get from our clients on equity market valuations – “Are they not too expensive?” The answer to this question will help our clients position their investment portfolios for the years ahead.
The Past Decade
The last ten years have been quite an extraordinary period for investors as new economic paradigms were floated, implemented and continued to dominate headlines. We started the decade on the back of one the worst global financial crises since the great depression of 1929, with the U.S. in the throes of a deep recession in 2009, with falling real GDP, rising unemployment and ever-growing government debt levels. Economies in the U.S. and Europe had to resort to unorthodox monetary policies – cutting real interest rates to negative – and to Quantitative Easing. In contrast to the bleak picture in the western world, Asia, led by China, was on a roll with economies quickly recovering, driven by pent up investment demand and rising domestic consumption. With such a backdrop, it was natural to believe that the best place to make returns in the years ahead would be Asia. The U.S. was the last place on anybody’s mind to put their money to work.
But ten years on, as we come to the close of this decade, the results could not have been farther from most prognosticators’ expectations. The best and maybe the only performing equity market over the last decade has been the U.S. stock market. For fundamental investors this may not be a surprise as the U.S. market in those days was full of good quality businesses, with earnings below potential and trading at reasonable valuations.
The chart alongside shows the performance of various global equity indices – the U.S., MSCI Asia ex Japan, developed world excluding the U.S. as well as MSCI Asean.
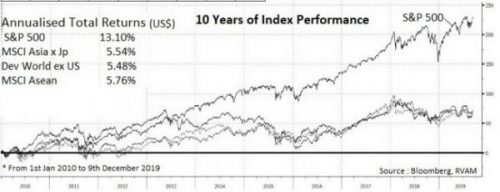
While the U.S. delivered a compounded annual return of 13.1% over the period, most other markets delivered less than half that level, around 5-6% level. The S&P500 index seems to have left the whole world behind. So much for a once-in-a-lifetime crisis.
What The Numbers Tell
It is this extraordinary performance that investors have in mind when they worry about the outlook for equity markets going forward. In our October 2018 write-up we touched upon this topic, comparing earnings growth, valuations and returns for the U.S. versus Asia. Since then both sets of markets have moved in sync and the conclusions of our report, i.e. on balance of probability, the returns from Asian markets going forward should be positive relative to returns from the U.S. market, continue to be valid.
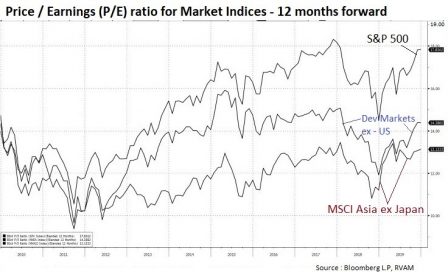
The graph alongside tracks the valuation of various markets over the last decade. Surprisingly, all major regions started the decade at similar forward P/E multiples – around 14x earnings. Since then the U.S. equity markets have benefitted not only from a monetary policy-induced growth recovery, but also from the extraordinary boost to earnings provided by Donald Trump’s unexpected and deep tax cuts of 2017.
Both these are likely to run their course over time, given the rising debt burden on one hand and the all-time high valuation multiples on the other, as the S&P500 index is trading at 20.9x trailing earnings and 17.8x forward forecast. This record high valuation is what investors have in mind when they worry about market valuations.
In contrast to U.S. equity markets, MSCI Asia ex Japan is currently trading at 13.1x forward earning while developed markets outside the U.S. are trading at 14.4x. In the case of Asia, we are most probably going to start the next decade at valuations which are below where we started off at the beginning of this decade. Clearly, Asia has faced its set of issues and challenges over the decade, but the fundamental drivers of growth continue to remain strong and robust in the region, giving confidence that the region will continue to be the best place to hunt for undervalued companies delivering growth in cashflows, which is what we look for.
The Macro Backdrop
The decade started off with concerns about economic growth and we are ending it with continuing uncertainties about global growth. Right through this, our core macro thesis of “lower for longer” has played out and we think it will continue to hold for the foreseeable future. As the debt burden in major economies slowly unwinds, it will keep a cap on every green shoot of recovery.
In addition to debt burden, the last few years of the decade have been characterised by extremely high levels of uncertainty brought about by political risk overhanging policy issues. The trigger for it was the Brexit vote three and a half years back followed by the election of Donald Trump as President of the United States, creating a completely new phase of international uncertainty as President Trump went about tearing up every existing rule book to deliver on his election promise of “America First”.
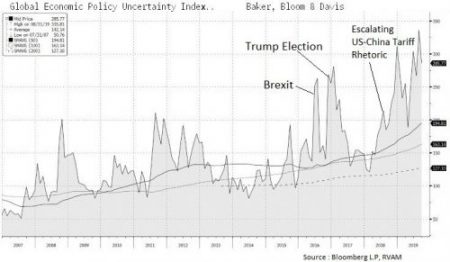
In Asia, our markets have been at the cross hairs of the worst of his rhetoric with every odd early morning tweet sending markets into the next spasm of wild guessing, looking for the next twist in the never-ending saga of the U.S.-China tariff wars. The chart above shows how global economic policy uncertainty has continued to ratchet up to ever higher levels. The optimists may look at the chart and think “perhaps it cannot get any worse”. But for markets, uncertainty is an overhang which keeps a lid on valuations and partly explains why Asia continues to trade at 13-14x. Perhaps the new year (or decade) will bring a new dawn and a solution to this trade war, though we think it is best not to expect solutions for problems that are intractable. That said, by this weekend, we could potentially see an end to the long drawn out “Brexit” saga as the U.K. goes to the polls and a population fed up with uncertainty may just about decide to put an end to it by voting for the least bad outcome.
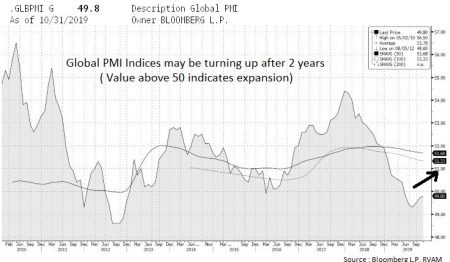
Cyclically we may be primed for a rebound if uncertainty recedes. Global PMI (a leading indicator for economic activity) seems to be turning up after two years of continuous decline as seen in the graph alongside. Many economic commentators are expecting a recovery given ample liquidity and low cost of capital in the world, but are missing just one ingredient – confidence. Asia seems to be mired in many uncertainties, whether they be the U.S.-China trade war, the ongoing saga of North Korea or the recently emerging political risk in Hong Kong.
But 2019 also saw the conclusion of a raft of elections in the Southern part of Asia which was supposed to bring about certainty and concomitant economic growth, but the performance of markets in Indonesia and India, two of the larger beneficiaries of this trend, belie expectations. We explore this in the next section and it goes back to the “lower for longer” thesis which we have held onto for some time.
Investing In A Low Inflation World
China, which was a significant driver of growth in Asia over the last decade, is seeing a slowdown in its rate of growth, a function of moving up into the ranks of a middle income economy. Growth in Asia is likely to shift to pockets where we can still find under-penetration. Asean and India nicely fit into this thesis. But many observers have been surprised at the low rate of growth observed in companies operating in these regions. Despite reasonable real GDP growth rate, companies are delivering slower sales and earning growth, which reflects lower nominal GDP, a feature of the low inflation levels globally.
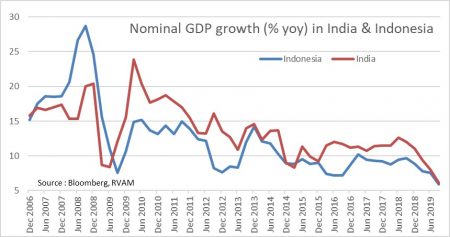
Writing about India and Indonesia in our August 2018 monthly, we commented on how both economies have managed to keep control on inflation and bring it down on a structural basis. Indonesia, which delivered a consistent 5% real GDP growth over this decade, has seen its nominal GDP growth fall over the same period from a 15% level to 5.9% in the recent quarter. Similary, high inflation in the early part of the decade resulted in a nominal growth rate of around 20% in India, which at 6.1% now looks shockingly low. Businesses which were used to high nominal growth are now struggling to adjust to an environment of lower topline growth. The challenge is most acute for companies with high leverage as it is no longer possible to inflate your way out of debt. This is a significant issue in India where corporate leverage continues to be high.
From an investment perspective, companies which used to command a high mutiple because of strong topline growth will face derating risk. The chart alongside shows the trend in nominal GDP growth for both India and Indonesia over the recent past. Given the shift in monetray policy framework in both these economies it is likely that over the next decade we will continue to see strong real GDP growth in both India and Indonesia without an accompanying inflation flare up as observed in the past.
In addition, continuing focus on invesment in infrastructure should abate infaltion pressures due to supply side bottlenecks.The best investment strategy for such an environment is to focus on cash flow instead of growth. Dividend paying stocks perform well in a deflationary environment as opposed to growth stocks which are seen as inflation hedges.
End
Disclaimer
This material is not intended as an offer or solicitation for the purchase or sale of any financial instrument. Information has been obtained from sources believed to be reliable. However, neither its accuracy and completeness, nor the opinions based thereon are guaranteed. Opinions and estimates constitute our judgement as of the date of this material and are subject to change without notice. Past performance is not indicative of future results. This information is directed at accredited investors and institutional investors only.