Every once in a while, we have a contributory write-up by Jeetu Panjabi, an independent board member of River Valley Core Compounding Fund. This was a topical article written by him three months ago. The views expressed are the author’s own. However, this broadly reflects our medium/ long term outlook on markets and global economic outlook.
Jeetu Panjabi
EM Capital Advisors – October 2020
We have heard a fairly large number of CEO’s talking about the difficult situation the world is going though from a health and economic perspective, and the rather pessimistic outlook that many observers have for the future. While the health concerns for the world are something we sympathize with, our belief is that the pessimistic economic view is a rear view mirror influenced belief and the future is far brighter than most can imagine.
Core Thesis
We believe that a brand new ‘Global Supercycle’ was born last quarter. A global supercycle is defined as 7-9 year economic cycle with some years of 8-10% nominal USD GDP growth. Like the 2002-2008 global cycle, this will be a synchronous cycle coupled and catalysed with USD weakness and an elevated deflator. It has all the makings of a supercycle measured through synchronicity and potential implications on businesses in the nominal world. The implications of this are that the world output that bottomed at $77 trillion annualized level in the June 2020 quarter, would grow at 8-10% per annum in nominal USD terms for the next few years and we should be sitting in a $ 100 trillion world before the sun sets in Hawaii in 2023. Asset implications imply that you stay long equities, especially as the Emerging World should come back strongly in the coming years.
How Do We Get There?
Most economic views are biased around observing a real GDP number for the world. The data has had little value to me as an equity investor; to me the deflator and the FX implications are far more relevant. In the last twenty years, the real world output grew in a narrow range of 2.5-4% most of the time. Essentially, the world grew about 3% per annum for most of the period excluding the global financial crisis period in 2008. The nominal world output however swung between -10% and +14% through this twenty-year period. This also explains why 2015 felt so bad despite global real GDP growing at 3.3%. The answer was visible in the nominal GDP growth which collapsed to -5% driven by a weak deflator and strong USD essentially driven by China.
The 2002-2008 period was a big supercycle in recent memory, driven by the emergence of China and the integration of global manufacturing supply chains. It translated into a huge economic boom and strong corporate RoE’s with great equity returns. The world output grew at over 10% per annum for five years in 2003-2008 taking world output from USD 33 tn to USD 61 tn in just six years.
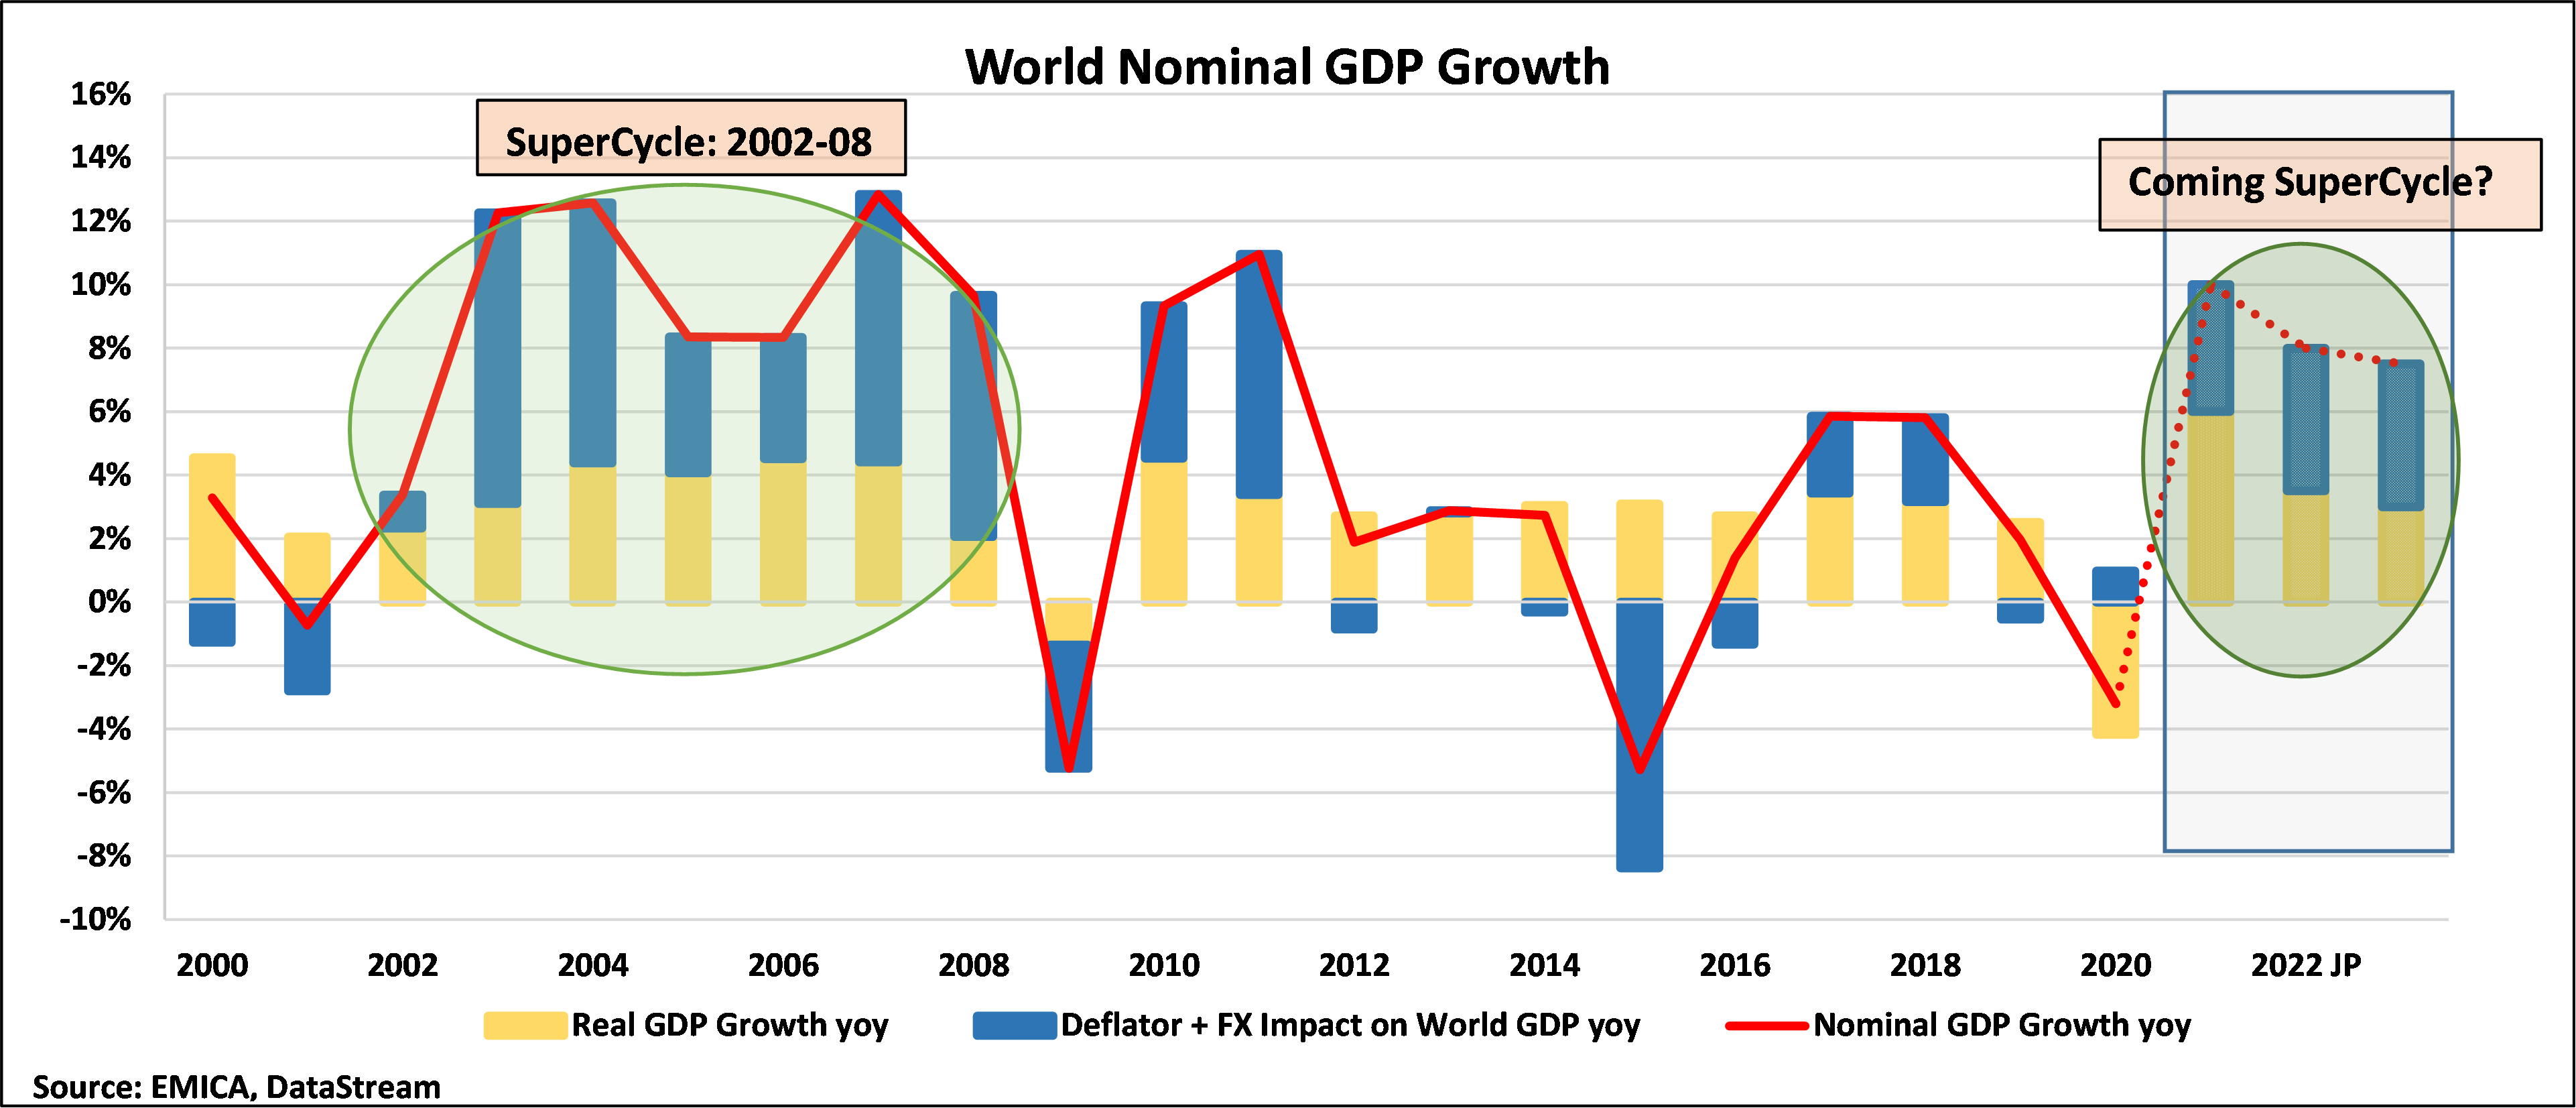
Fig 1
The Emerging Market (EM) share of world output in the last twenty years doubled from 19% to 38% with the EM world growing at about double the rate of the Developed Markets (DM). This kept the total world growth at a 3-3.5% range over the last decade despite every region in the world growing a little slower than in the previous decade. The implications of the swings in the global deflator and movement in FX on businesses and global incomes were much larger than most imagined which is visible in Fig 1 above. It breaks down the world output and its components showing that the world in real terms grew at a pretty even rate of 3-3.5% through most of the last twenty years with the swing in the ‘Deflator+FX component’ creating the big booms or bust feel in the world.
We are entering another such ‘supercycle’ which was born about one quarter ago. Our definition of a supercycle is nominal world output growing at 8-10% for a few years, lifting most boats globally. Our view on the components of this global supercycle are essentially building in a few key assumptions –
- The world growth in real terms continues in the 3% +/- 1% range after normalizing to pre-COVID-19 levels in real terms by 2022. This is line with estimates by the IMF and many others.
- We expect the global deflator to stay elevated in the 2-4% range for the next few years driven by stimulative fiscal and monetary policy by most large world economies. This would be aided by a weaker USD.
- The USD weakens 3-4% per annum for the next few years with rising deficits, with the Chinese yuan doing the heavy lifting on the other side. This paves the way for a strong Asian and EM FX basket which together accounts for over half of the world output. This is in a way similar to what happened in 2003-2005.
Putting this view into our nominal world output model, we expect a global synchronous recovery which is typical when all parts of the world are in the same ‘phase 0’ of their economic cycle at the same point in time. This is essentially catalysed through significant fiscal and monetary stimulus at work to bring back world growth. This in turn translates into a reflationary environment with positive tailwinds for businesses. This, coupled with a weaker USD thesis, results in nominal world output growing at 8-10% for the next few years and the world GDP crossing $100 tn in 2023.
Two trends that we expect to see concurrent to this view are –
- The global trade equilibrium continues despite rhetoric to the contrary. The U.S.-China trade deficit coming in at an all-time high as shown in Fig 2 below confirms our view. We do expect Vietnam, Bangladesh and India to be beneficiaries from shifts away from China on the margin.
- World integration 2.0 continues through acceleration on the ‘Data’ and ‘Services’ side which then enables tier 2 and tier 3 layers of the skilled world to integrate with the developed economy without H1B barriers. Countries with large pools of skilled capital thus see their incomes grow faster and the 130 mn kids that turn 20 each year globally are going to see their aspirations in this new world opportunity. India is a big beneficiary here.
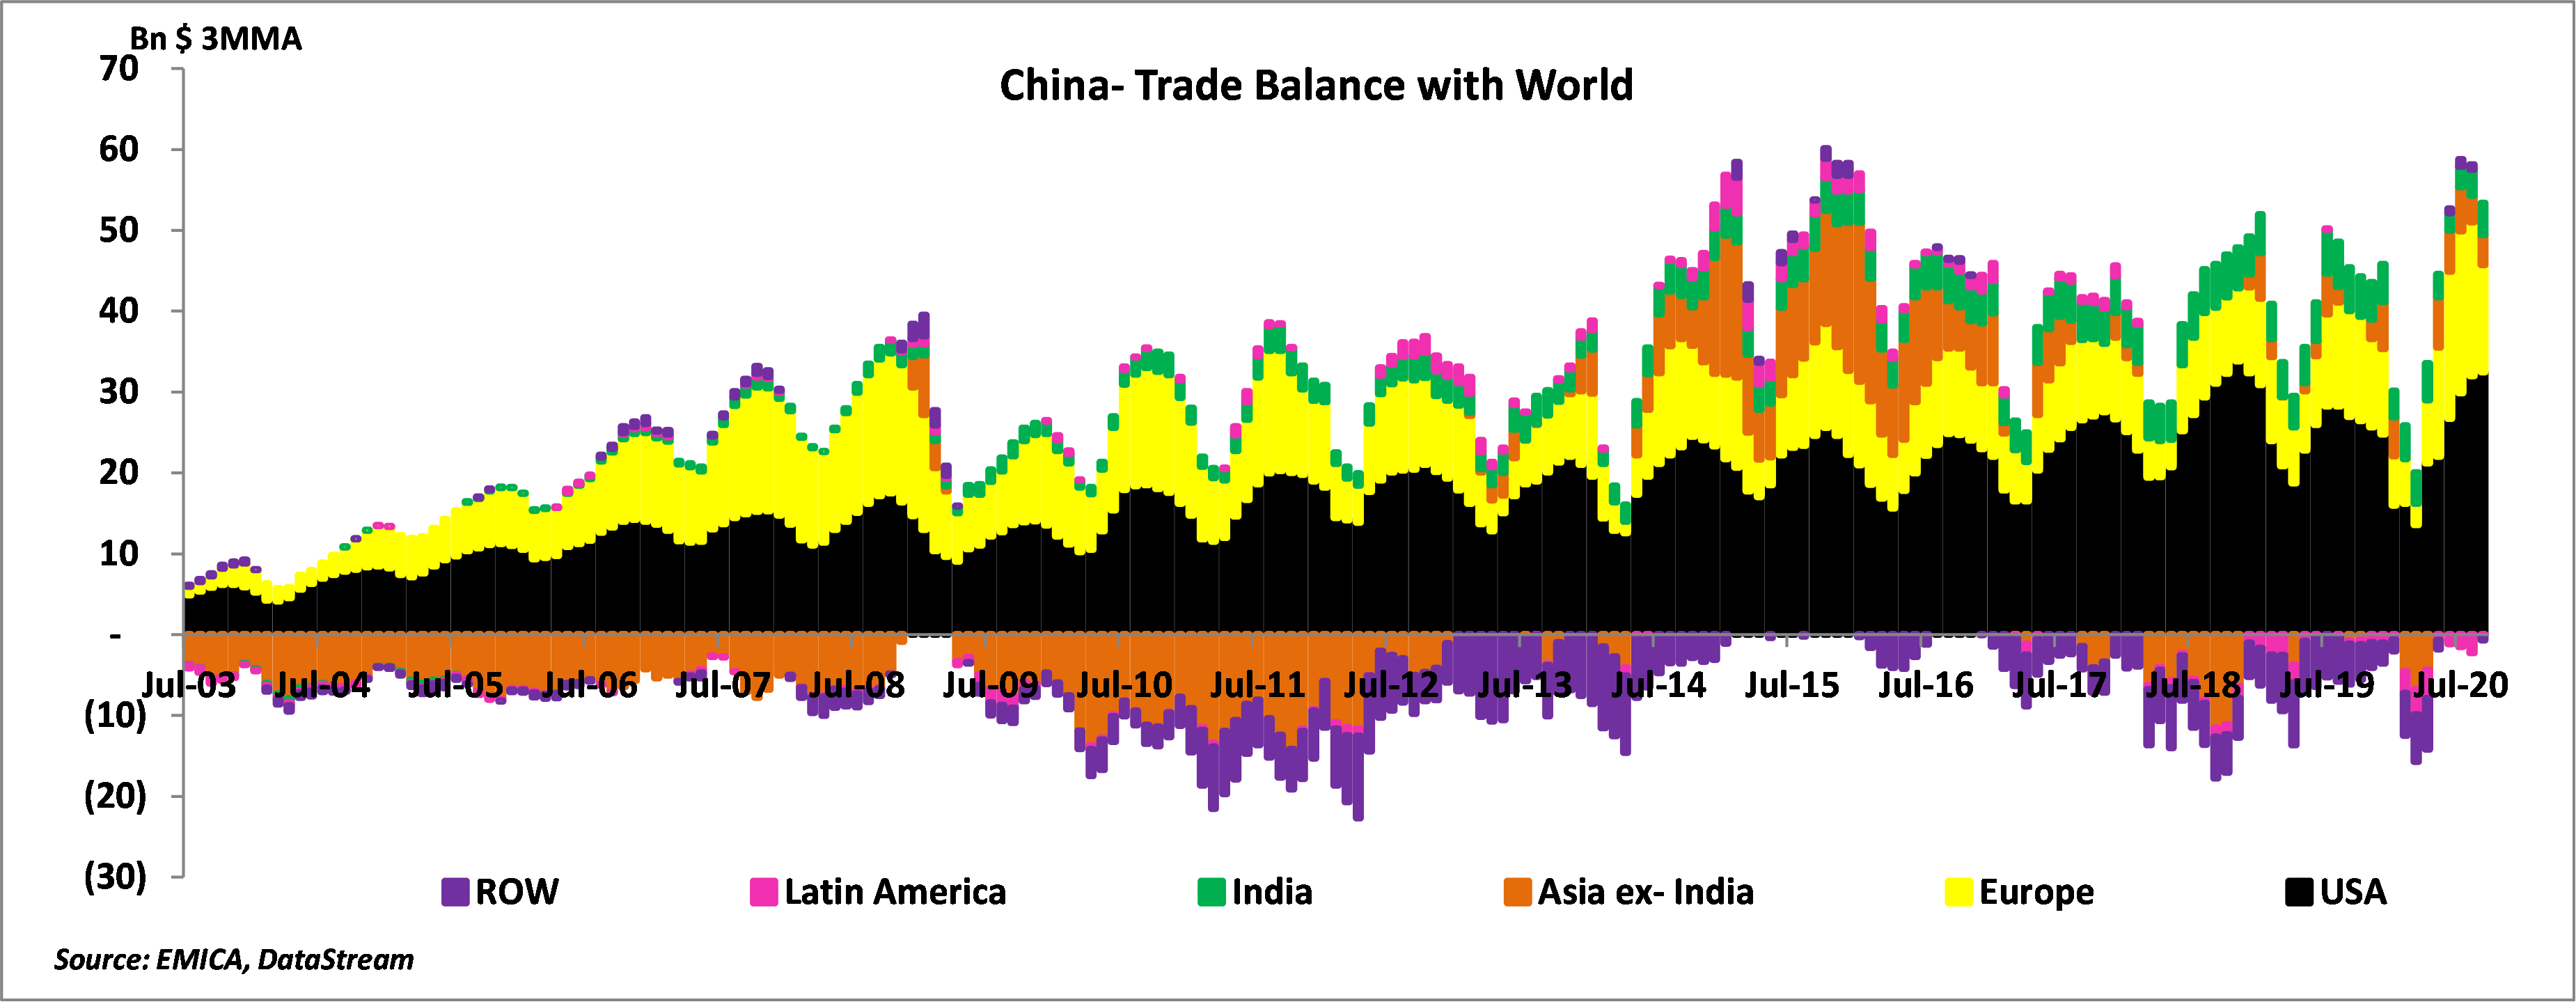
Fig 2
What Are The Implications For Business
Businesses globally are just coming out of this extremely difficult period. We see aggregate RoE’s for businesses turning up after the last quarter which is a classic turn that we have seen during the birth of previous cycles. This is visible in Fig 3 below. We see the World RoE getting back to 12% in the next 18-24 months. Concurrently, there is fresh capital put to work in quality companies, giving them the ability to get a larger piece of the cake. This embeds a view that capex picks up meaningfully only a few years from now, which aids the RoE upcycle in the next couple of years.
We also believe that the qualitative abilities of companies have been stress-tested to look for survival biases. It is now pretty clear which companies have the clarity of mind and strategy to navigate this crisis and possibly thrive in it. We can see a “K” shaped recovery at work in our analysis across 1000’s of businesses. There are some that would never be able to get back while others would thrive in this chaos.
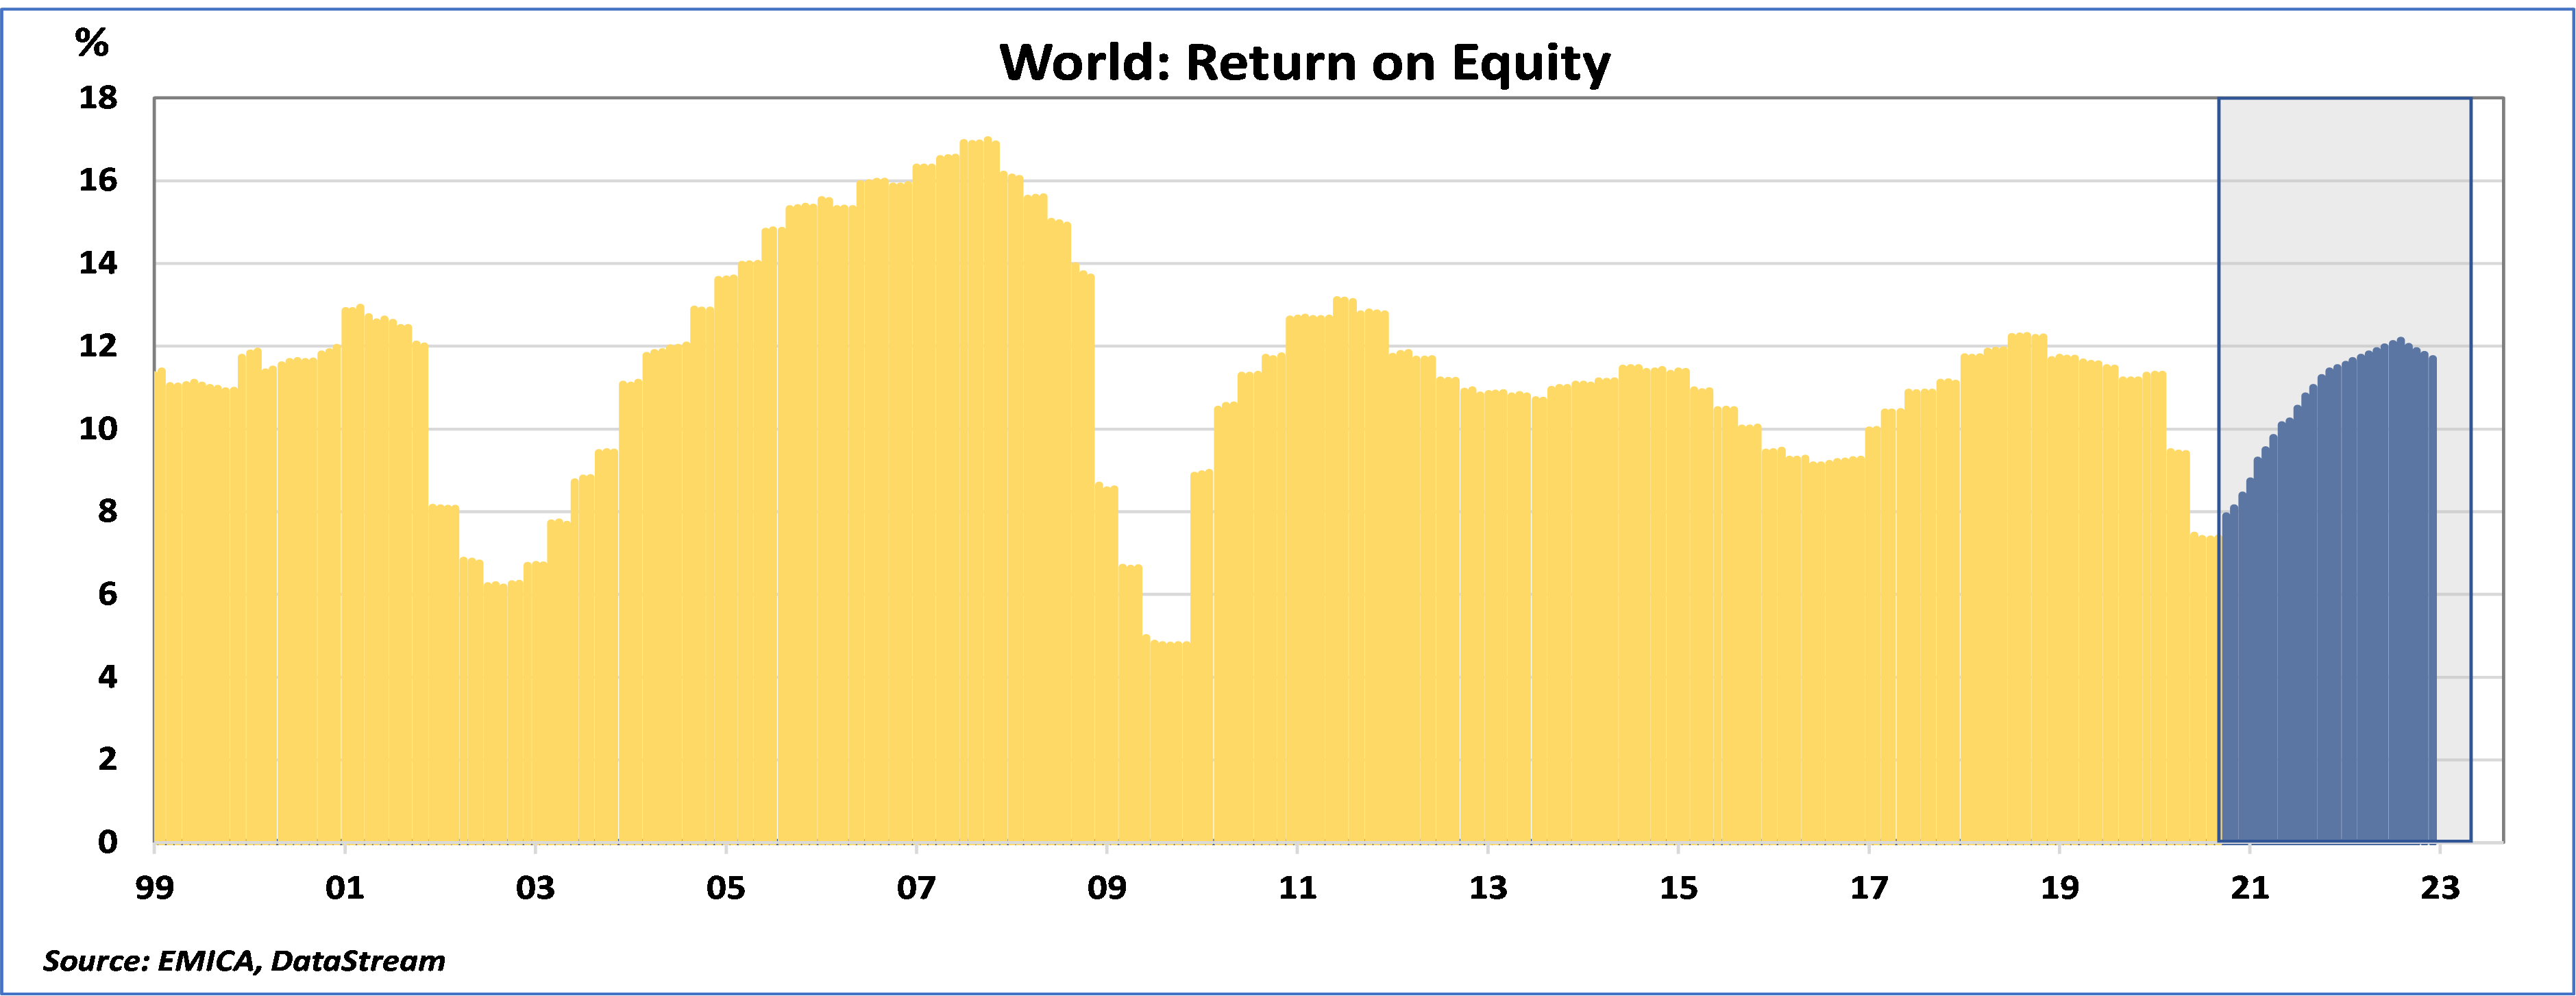
Fig 3
How Would I Invest Through This Thesis?
As a business manager, I would be ensuring I have enough capacity and resources including capital to be able to monetize this coming opportunity. It may differ across businesses and could also have an exposure to corporate disruptors.
As an investor, I would stay long equities and especially so EM equities as the business transmission of this boom plays out over the next 18-24 months. I would map our ‘global liquidity’ model in Fig 4 below to signal a peaking in the liquidity cycle. The transmission in liquidity would play out through the classic channels – financial and banking sector capital flows.
I would map companies, sectors and countries driven by our analytics with an optimism bias overlay on top of this. From a 12-18 month horizon, Consumer Discretionary, Non-capex Industrials and Financials should be a good place to be. EM’s and especially Asia are well positioned, including deep cyclical industrial economies like Europe, as the global economy feels the tailwinds in its sails.
An example here: we are extremely constructive on the ‘Class 8’ trucks segment in the U.S. and the entire global supply chains feeding into this should be geared up for higher order schedules by the end of 2021.
Another example is riding the leveraging cycle that is just about to begin. I would stay invested in some of the high-quality financial franchises which have the ability to earn a decent RoE through structural moats while staying competitive in a disruptive business environment.
I think of ‘Services’ as a big theme that has significantly been ‘geo-neutralized’ in a lot of pockets in a post-COVID-19 world, which passes on competitive advantage to countries like India and the Philippines where there is a strong cultural service-oriented bias.
I particularly feel good about India where services as a core competitive advantage continue to thrive, with manufacturing and agricultural reform turning a few key core sectors upwards and fresh doses of banking capital through markets drive balance sheet capacity to grow. This, coupled with demand from the U.S./ Europe, should kick start a new cycle and bring back RoE’s with fewer good players standing after many bad players got cleaned up in the last five years. The digital infrastructure put to work should catalyse the opportunity and enable ‘Services’ to thrive more seamlessly.
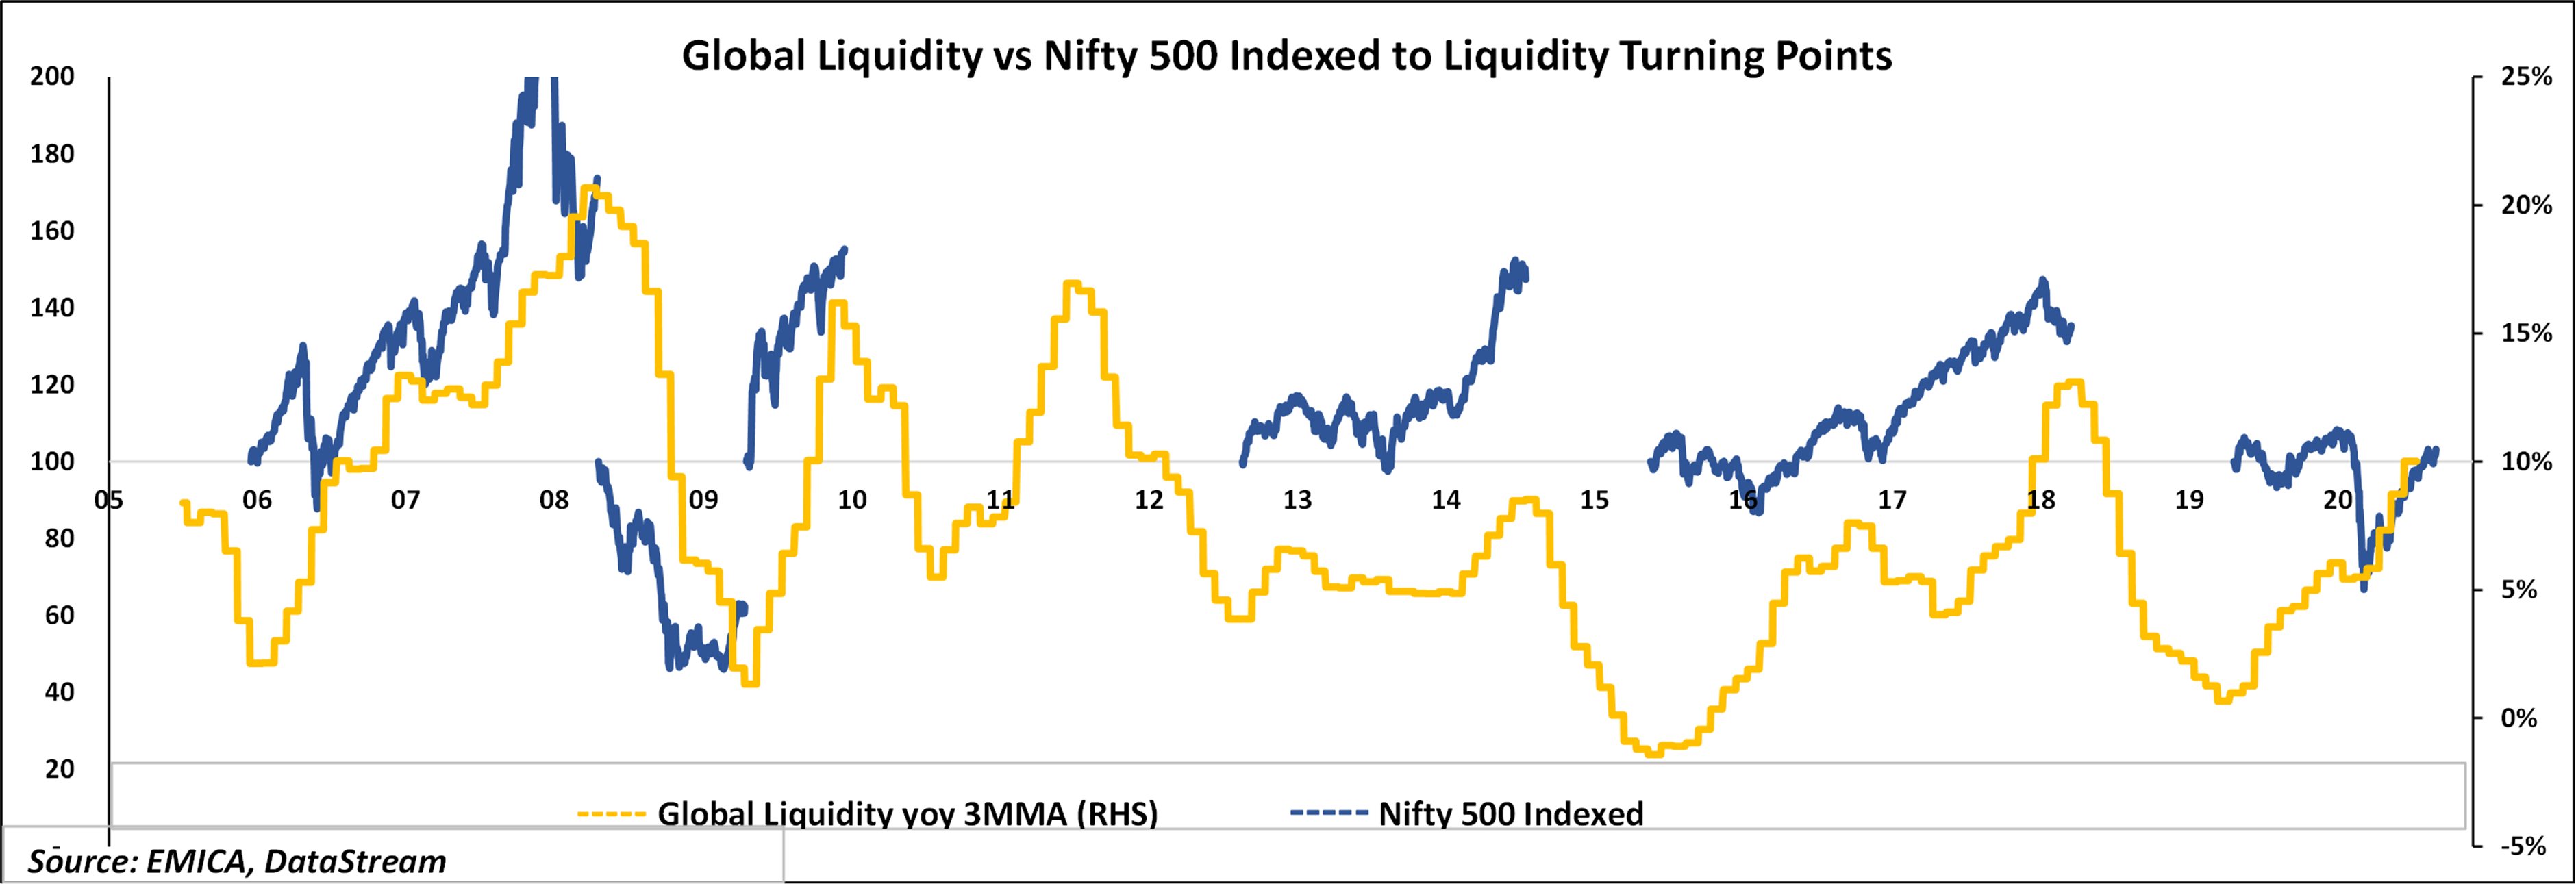
Fig 4
Risks To This Thesis
- The risk that COVID-19 related challenges get much worse than the current situation, resulting in larger economic weakness than we factor in.
- The risk of the new U.S. administration or other potential events shifting policy from the easy stance on fiscal and monetary stimulus currently at work.
- The risk of a significant geopolitical event like a China-U.S. South China Sea escalation that disturbs the equilibrium we see in the world currently.
End
Disclaimer
This material is not intended as an offer or solicitation for the purchase or sale of any financial instrument. Information has been obtained from sources believed to be reliable. However, neither its accuracy and completeness, nor the opinions based thereon are guaranteed. Opinions and estimates constitute our judgement as of the date of this material and are subject to change without notice. Past performance is not indicative of future results. This information is directed at accredited investors and institutional investors only.